Statistics
This content is located inside the administration module.
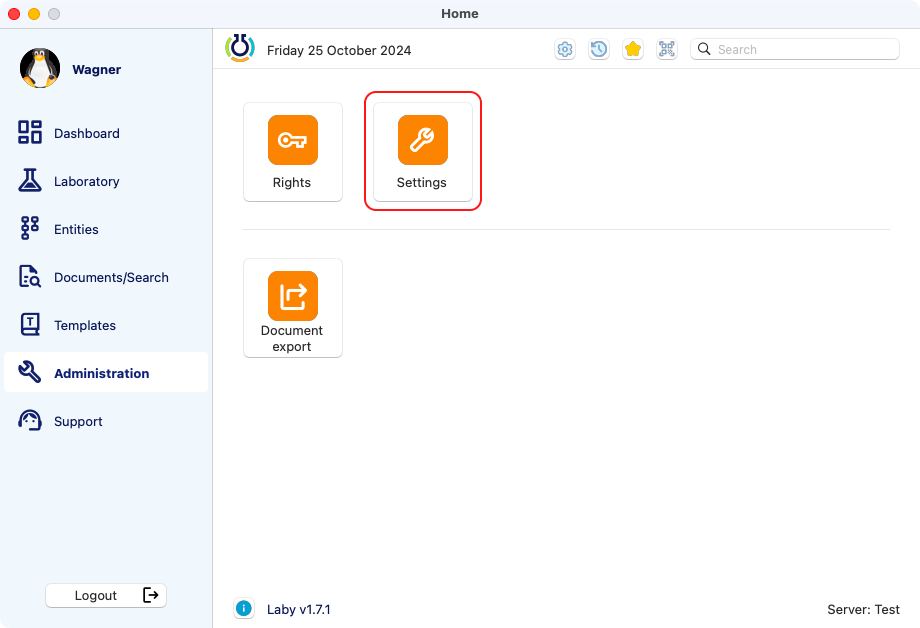
View of the administration section in the dashboard.
Inside the module you can have an overview of several metrics organized in three groups:
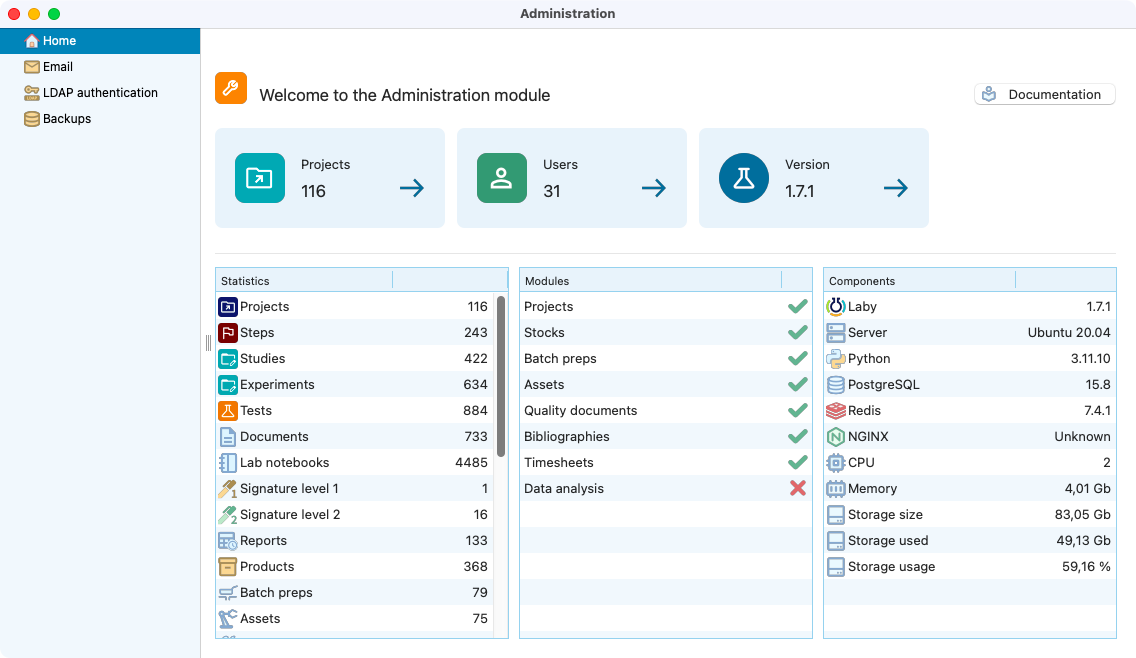
View of the administration home page, with the statistics displayed.
Statistics
It contains data related to the quantity of entities and actions inside the software such as:
Projects.
Steps.
Studies.
Experiments.
Tests.
Documents.
Lab notebooks.
Signature Level 1.
Signature Level 2.
Reports.
Products.
Batch preps.
Assets.
Maintenances.
Quality Documents.
Bibliographies.
Timesheets (hours).
Users.
Tiers.
Project templates.
Notebook templates.
Label templates.
Test types (activities).
Document types.
Notebook types.
Modules
This group contain teh global view of modules that are actives in your company. They are marked with a check or a cross, active and inactive, respectively.
Components
Here is displayed technical components, such as the software’s version, database and server. Also infos about the storage and memory. The complete list of components is found below:
Laby version.
Server.
Python.
PostgreSQL.
Redis.
NGINX.
CPU.
Memory.
Storage (size, used and %).