
Test details
Definition
The test is the lowest level of the research project dedicated to recording all the information from a test conducted in the laboratory. Laby has different sections that make it easy to record all the useful information and find it at a glance.
Remember
The hierarchy follows this order:
Program > Project > Step > Study > Experiment > Test
Presentation
Here is a table containing a short description of the sections in the test detailed window:
Section |
General description |
|---|---|
Define all the dates and the responsible. |
|
Update your protocol from a template using Word, Excel or PowerPoint. |
|
Store photos, videos and raw data (xls, csv), plus specialized files (SnapGene, GraphPad, PyMOL, Marvin Sketch, Open Vector Editor etc.). |
|
Record data in a structured table for easy analysis and sharing across projects. |
|
Link stock items used for traceability and automatic stock quantity updates. |
|
Specify equipment used and optionally book it; no separate logbook required. |
|
Read-only standard quality documents linked to the test type. |
|
Generate reports that include project info, responsible, dates, documents, items and equipment. |
|
Add keywords to improve searchability and enforce consistency. |
|
Lock the test to prevent modifications once finalized (dates required). |
|
View the origin and full context of this test with one click. |
|
Inspect which users have access and their permissions. |
|
Full modification history with filters for action type, user and date. |
Home
Here is a typical test window, where you can manage general information such as:
Start date and end date –> will update the gantt view on the project level.
Due date and assignee –> will inform your colleagues by email and shown on their dashboard.
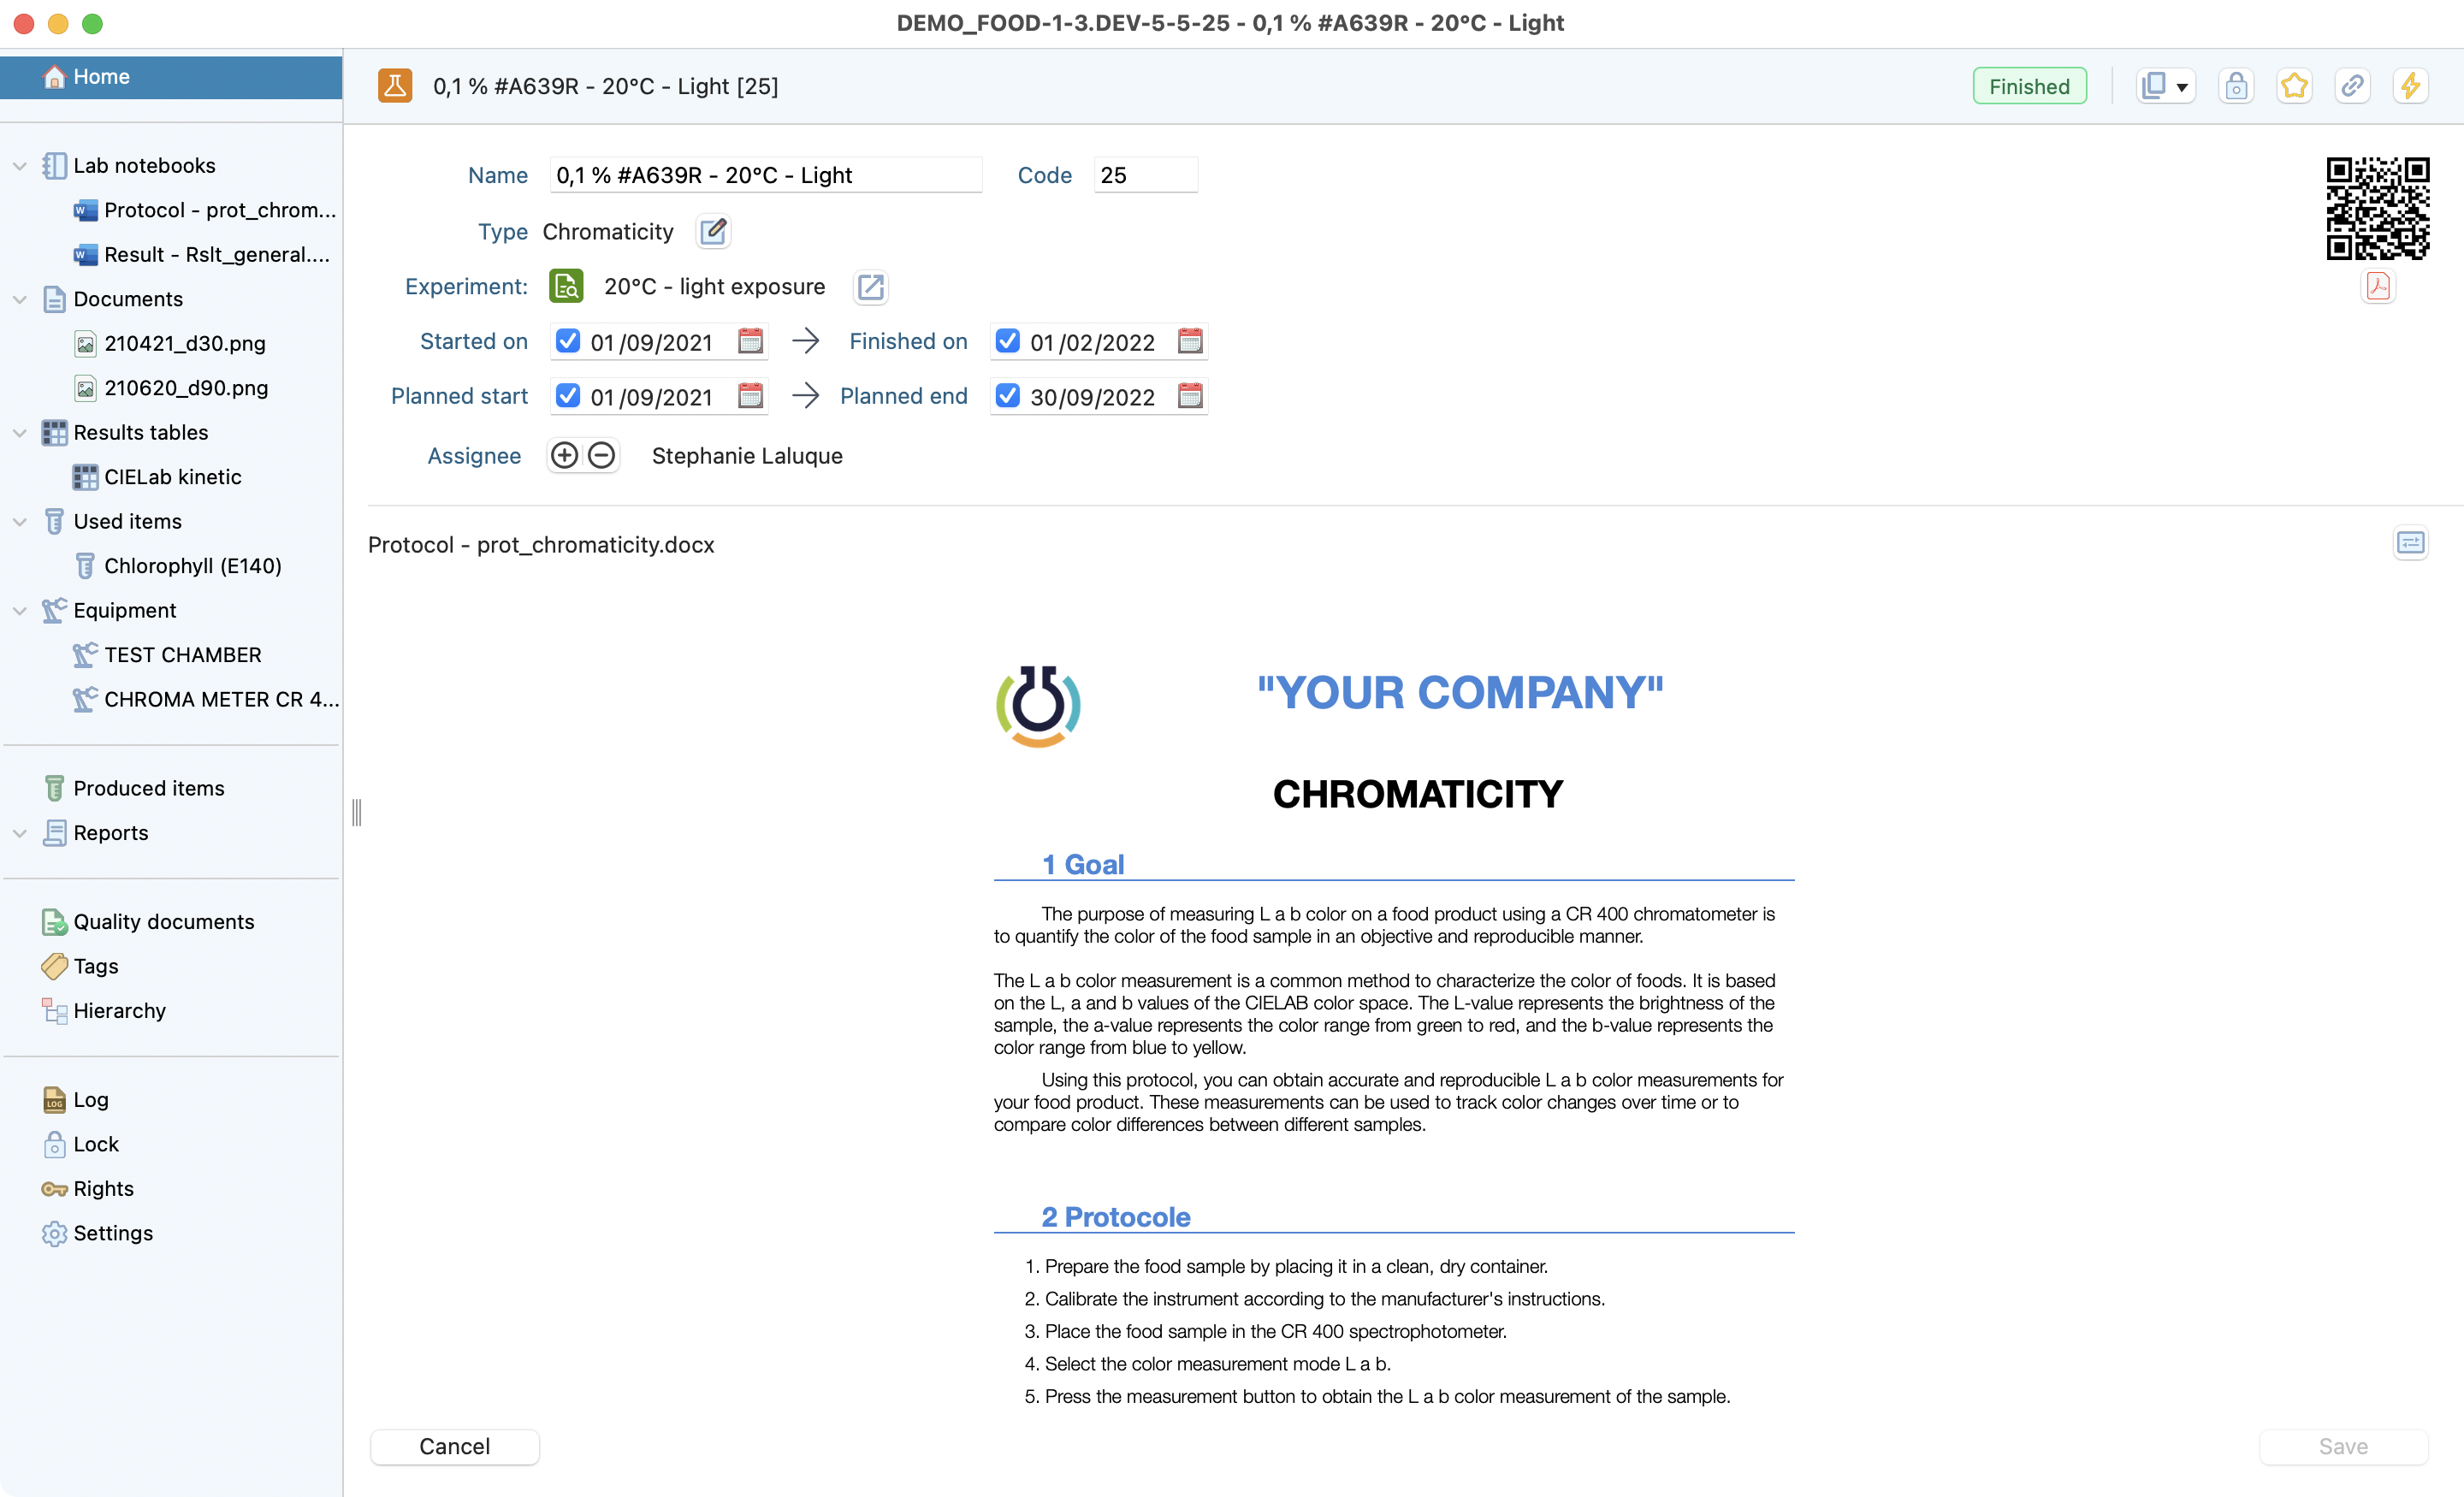
View of the test’s homepage.
Electronic Lab Notebook
Laby saves time with notebook templates that automatically load based on your test type, or you can start with a blank page.
For template setup details, see Notebook templates.
To edit your lab notes, click on edit button ![]() .
.
Laby launches Microsoft Office or LibreOffice based on your preferences, so you can continue using your favorite software with all features like images, tables, text formatting, revisions, and third-party integrations.
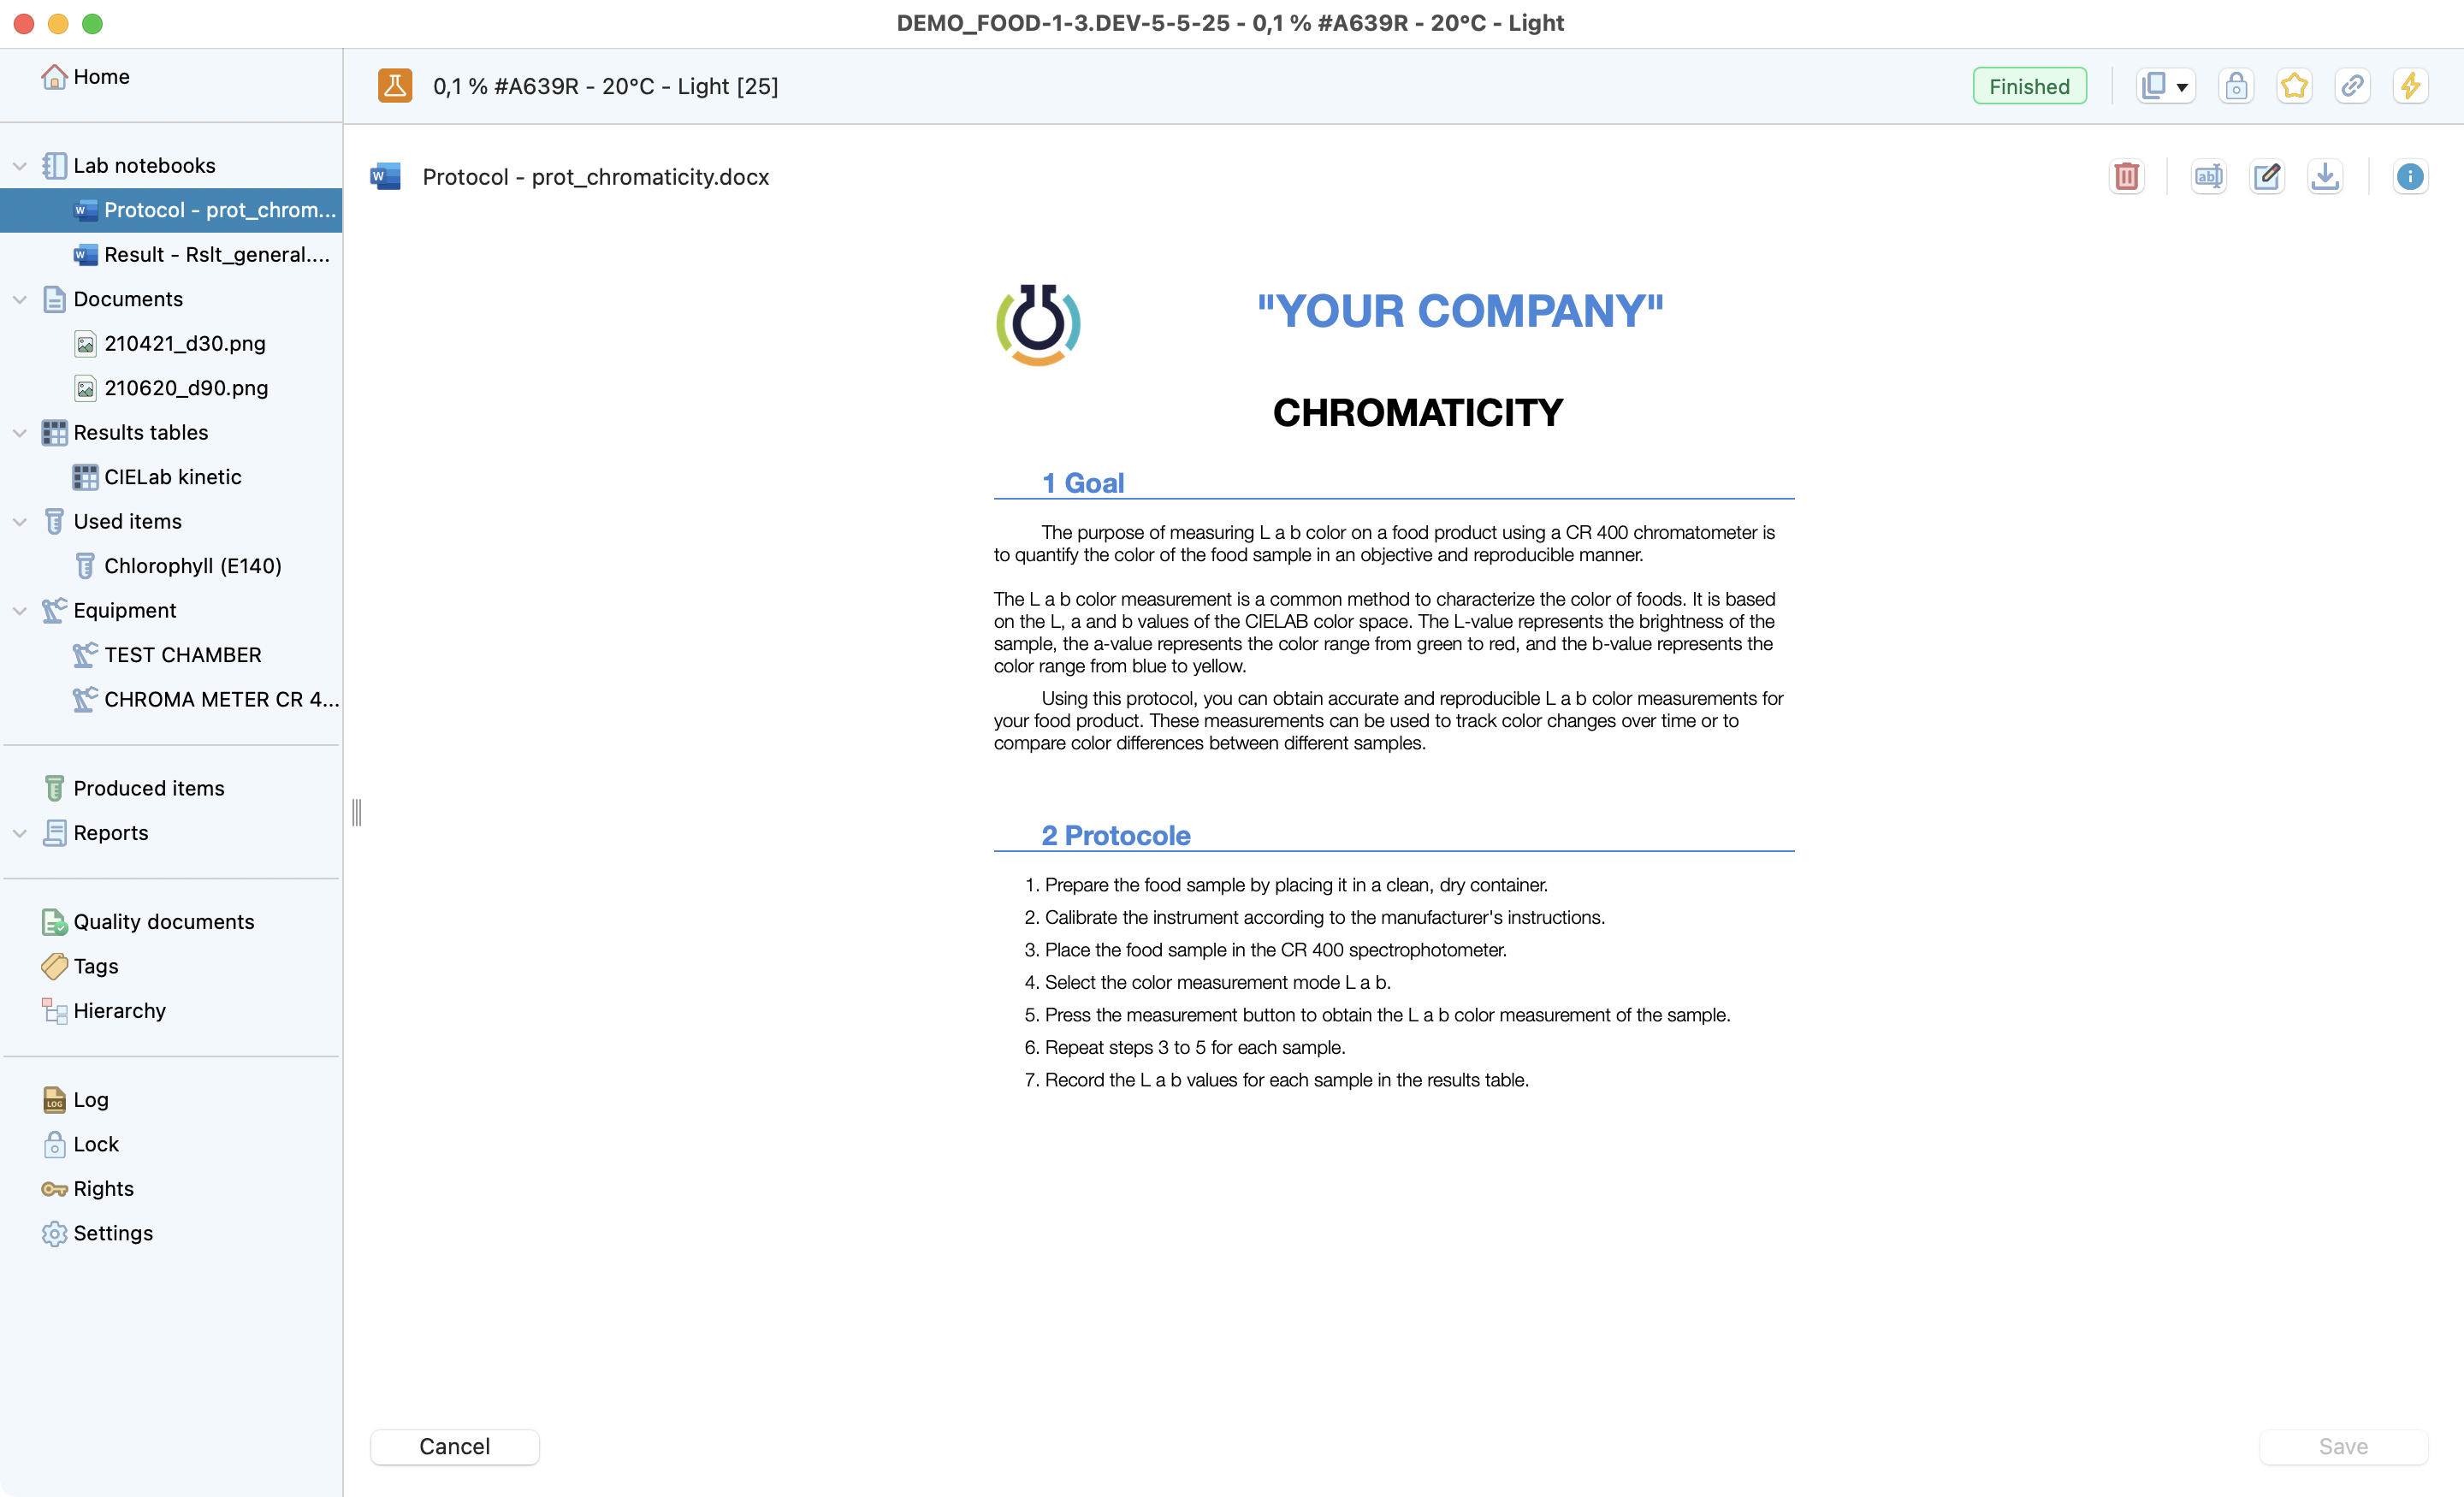
Notebook preview.
Info
Your notebook will be automatically saved on Laby server.
Documents
The document area provides a centralized location to store all documents related to a lab experiment, including Excel, Word, images, PDFs, PowerPoint, SnapGene, GraphPad, Marvin Sketch, Python files, and MP4s.
This ensures experiment data is organized, easily accessible, and can be located quickly when needed.
Tip
Just drag and drop your file to the document area or use the upload button. File drop also works on the document label of the side list and on the “entity” label of the program hierarchy.
You can also download one or several file once with the actions menu.
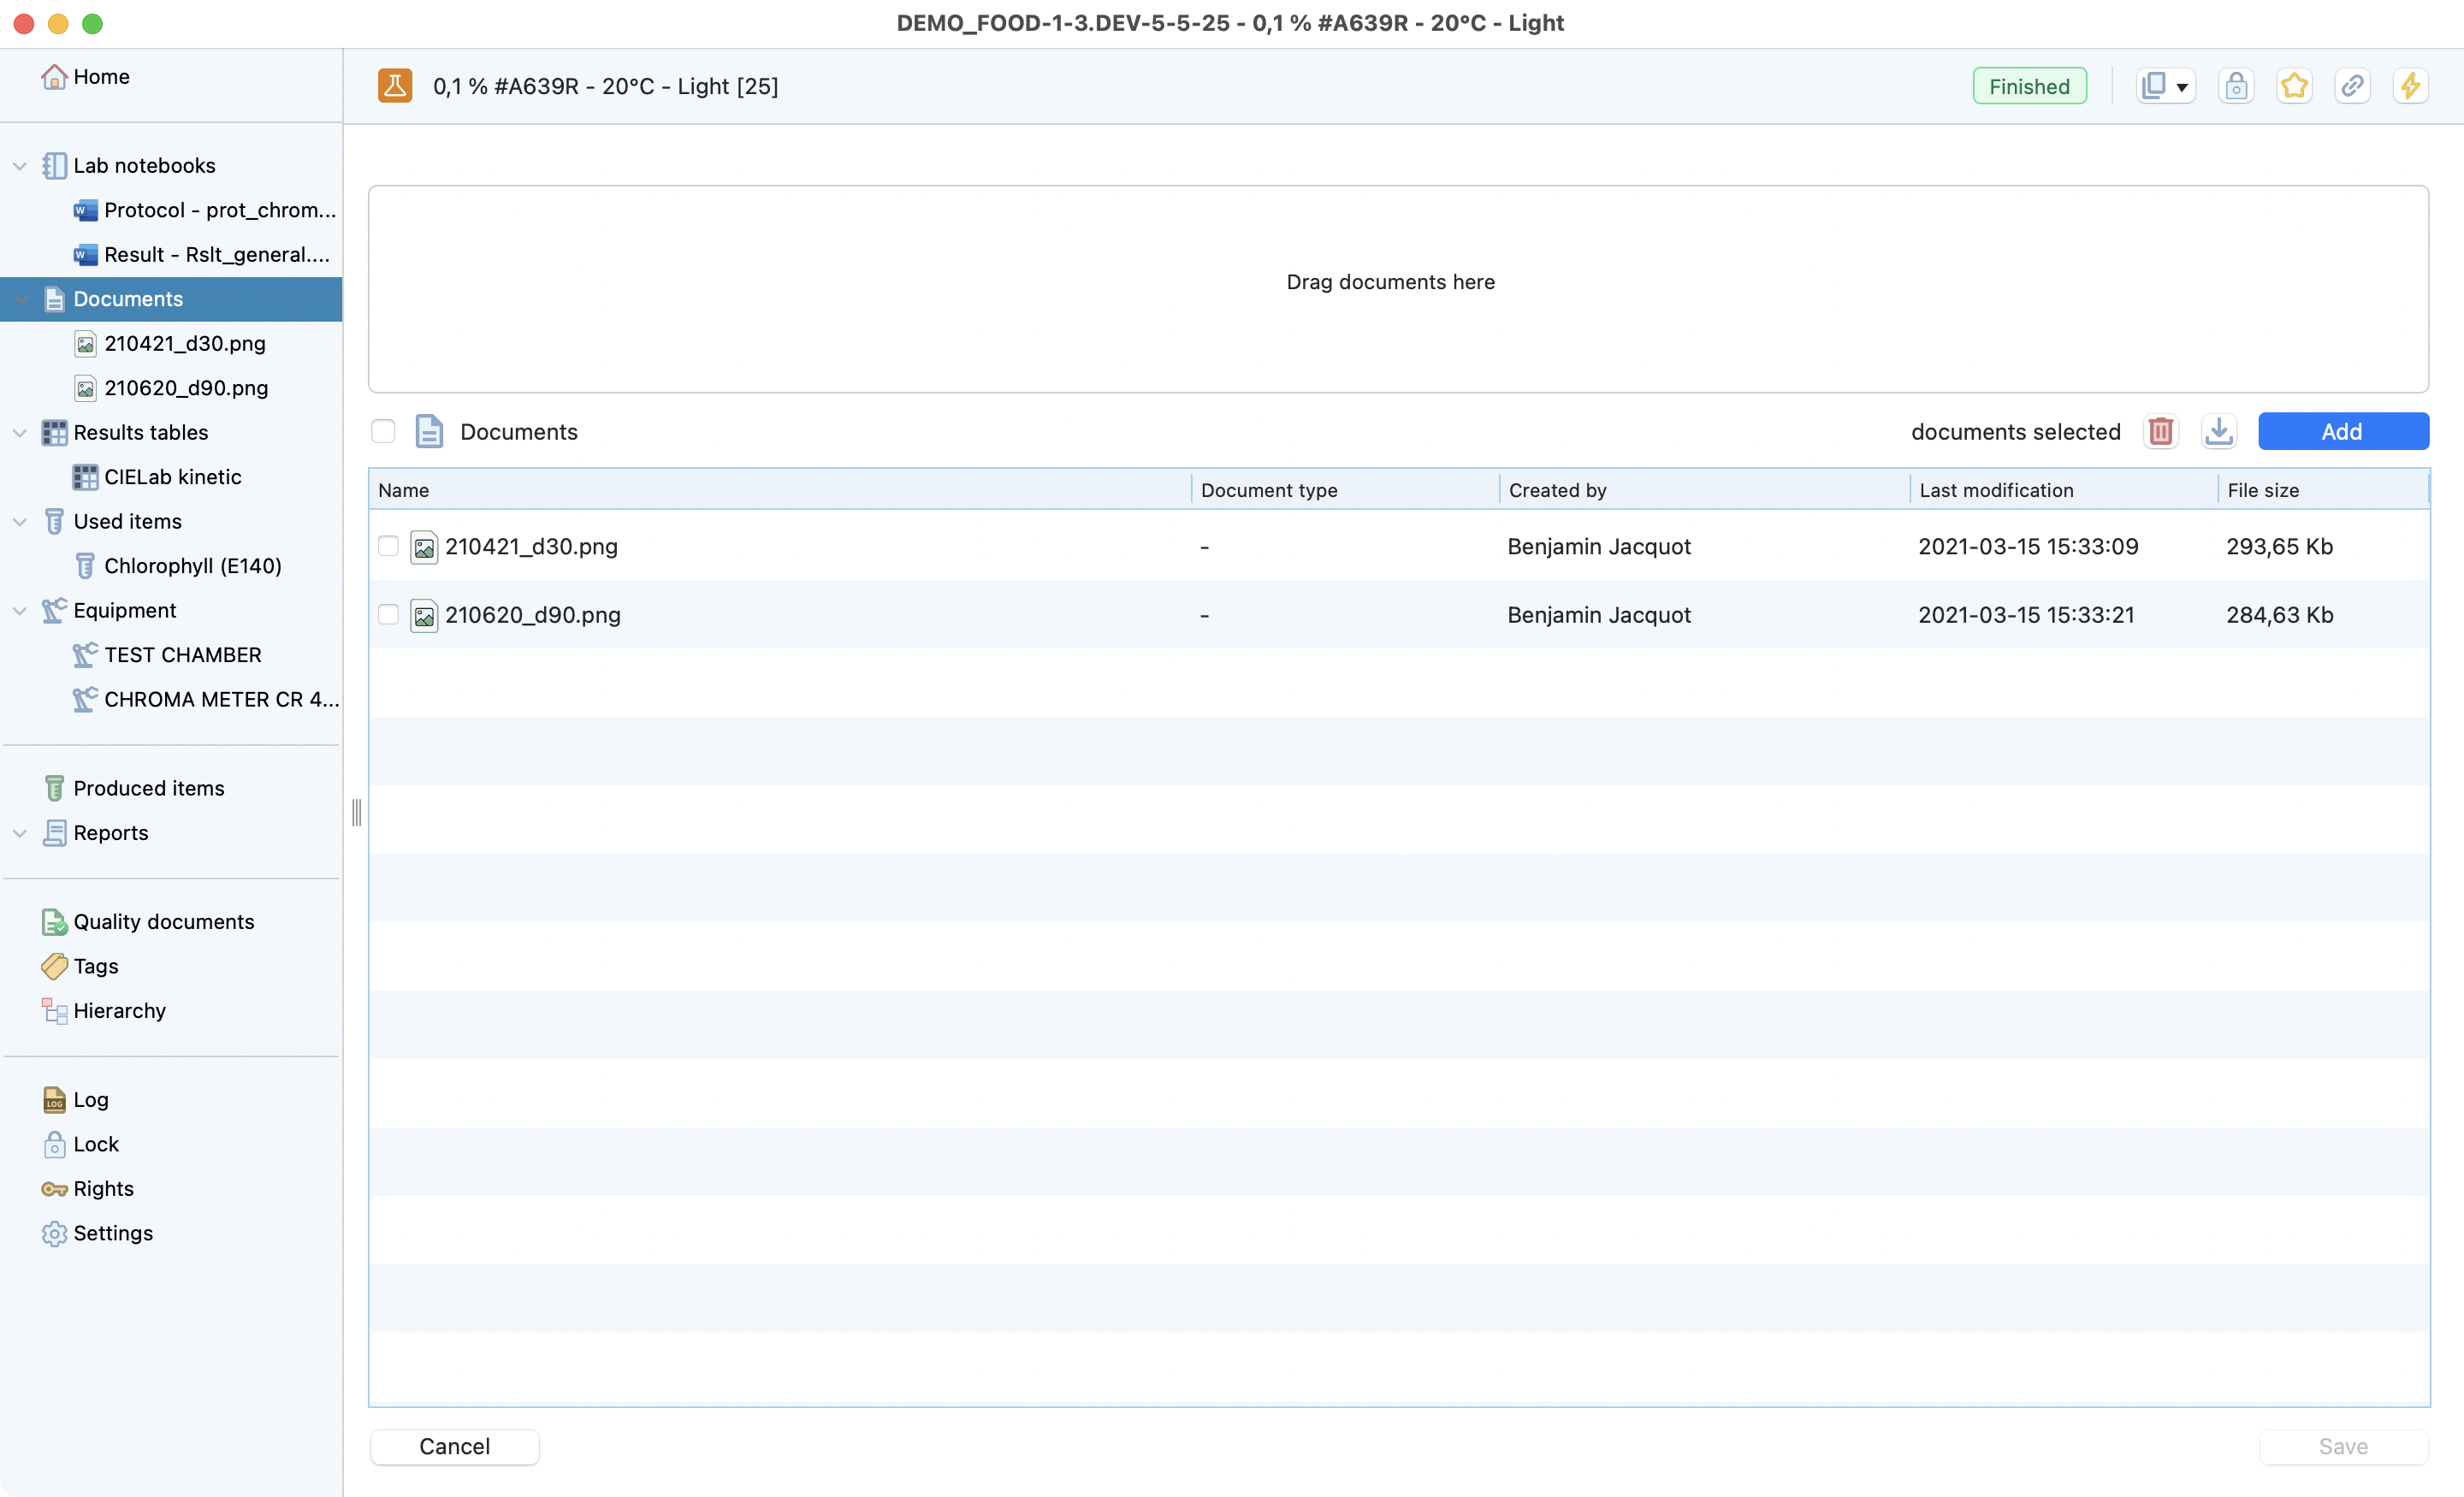
Documents list, showing how to upload files.
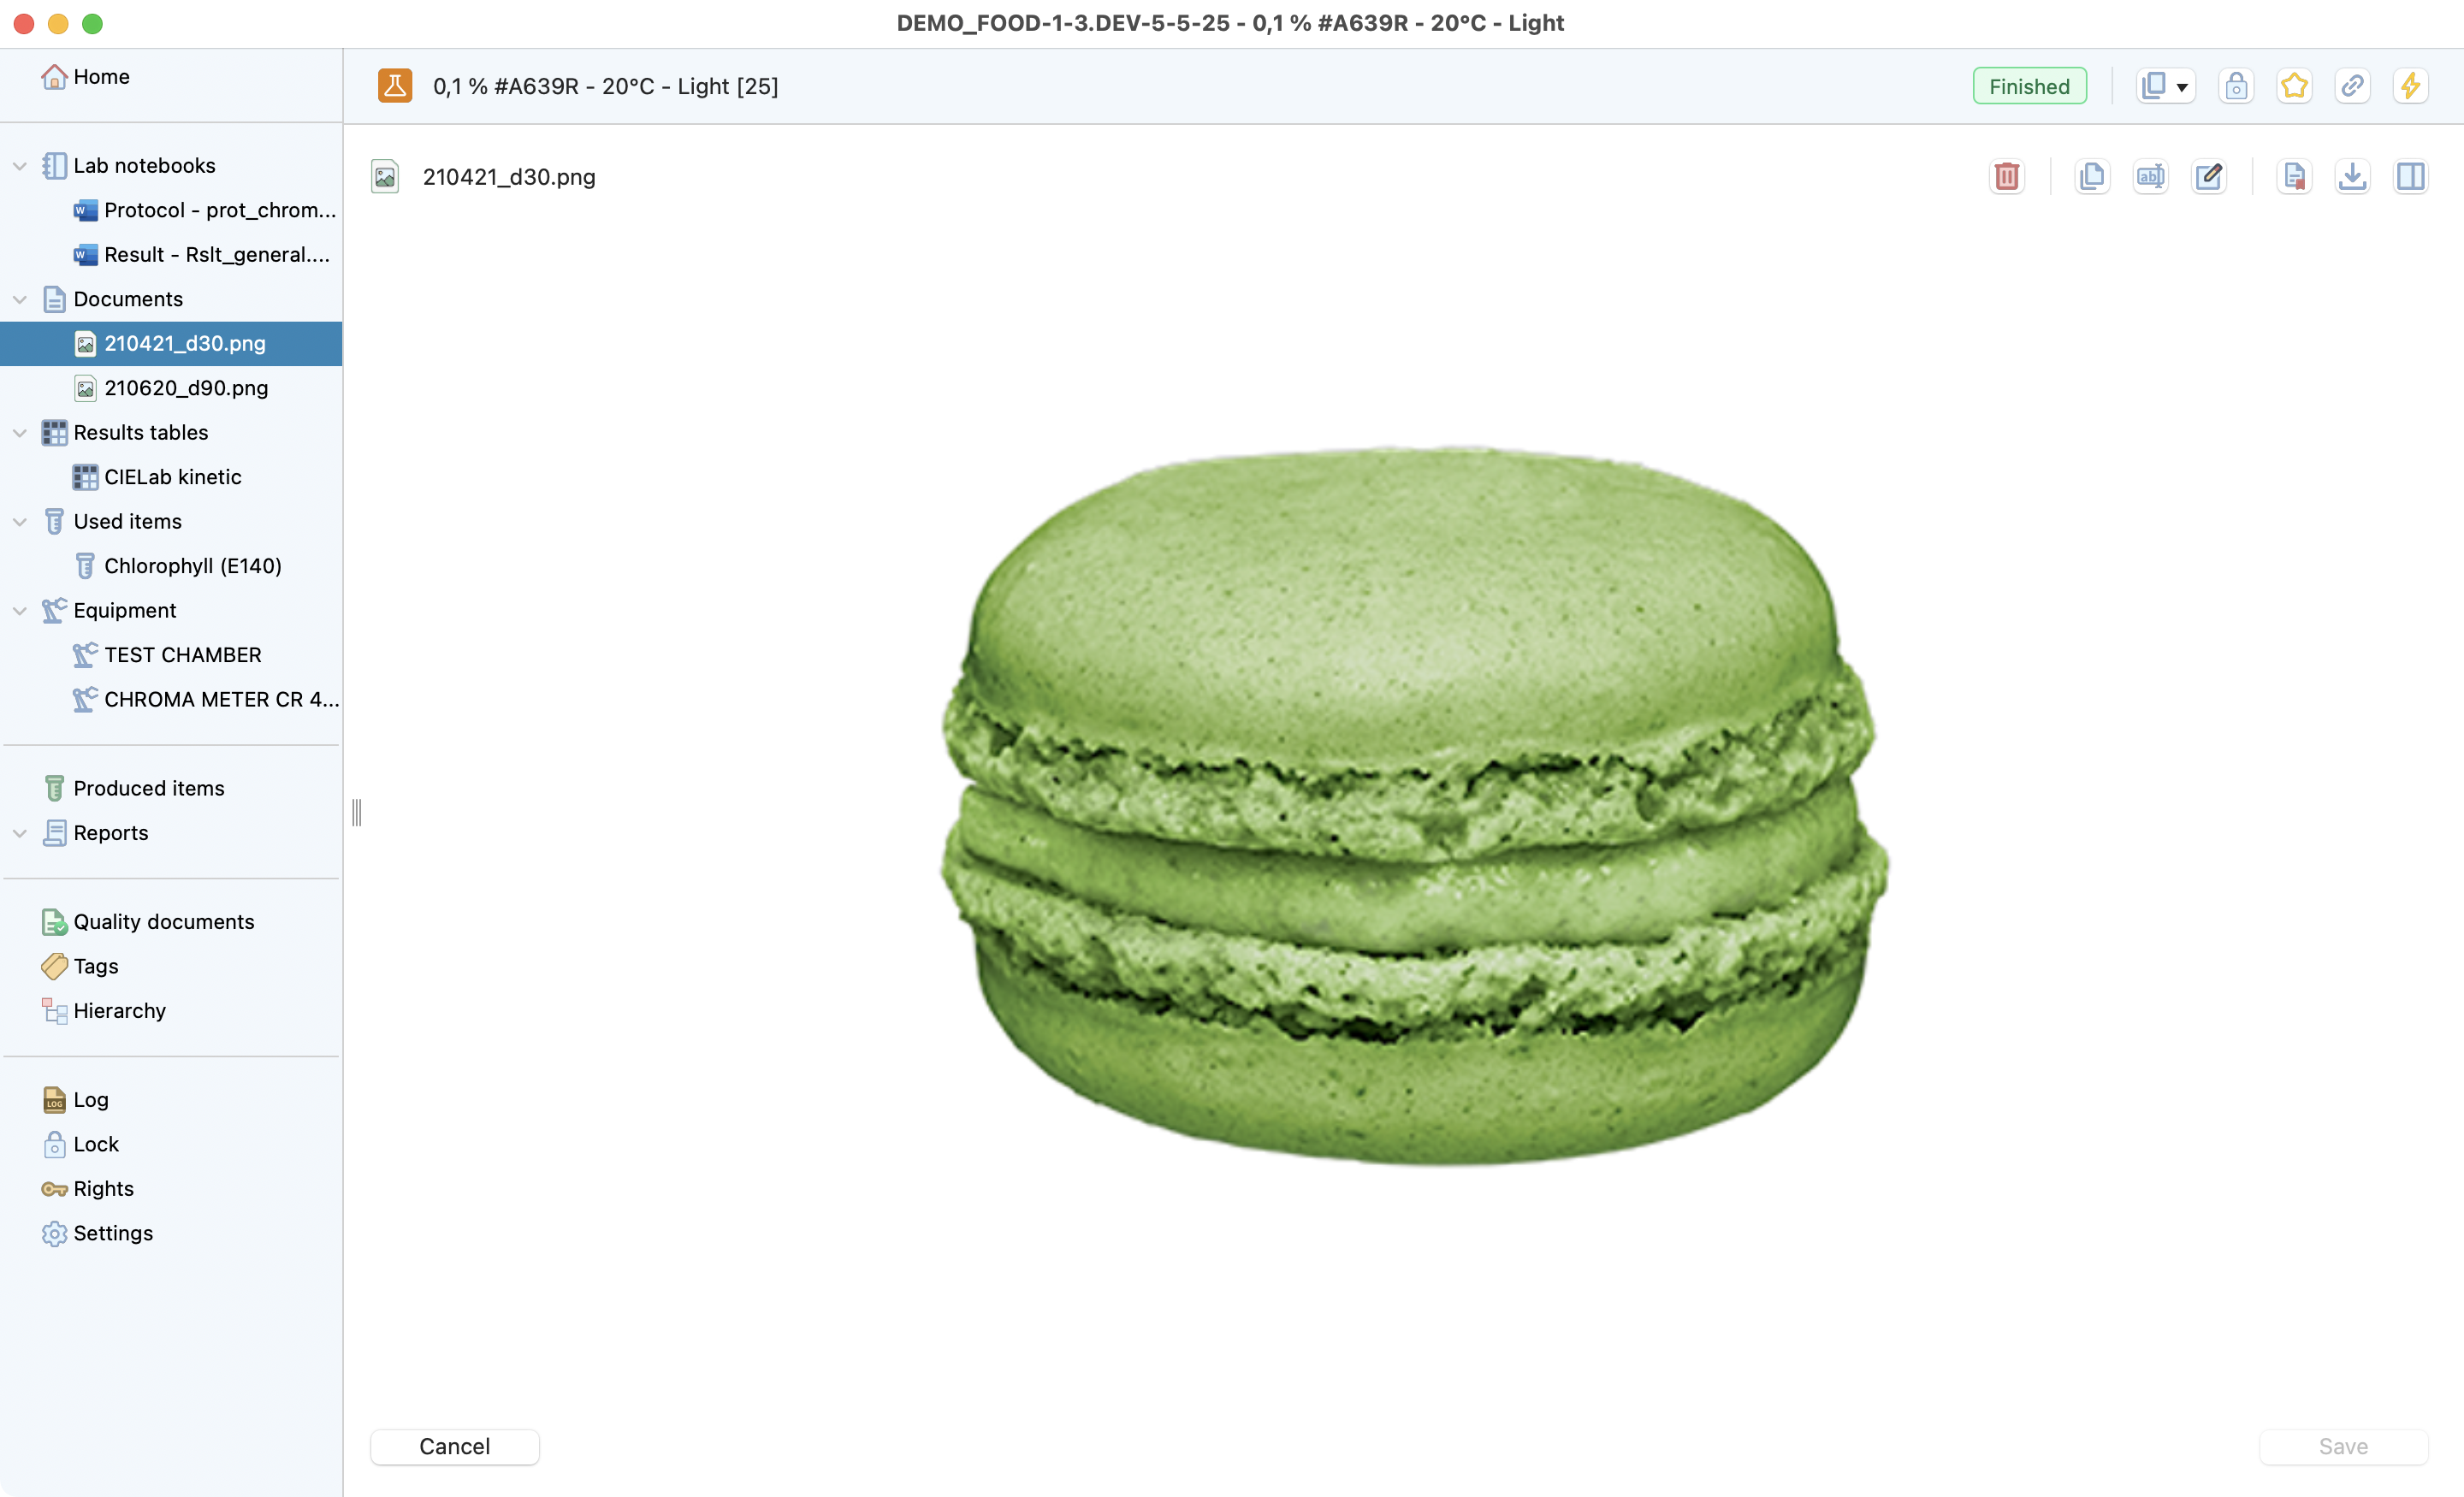
Image selected on documents. With all the actions highlighted
Results Tables
The data recording functionality in our software allows users to easily record data in a structured format. This is accomplished through the use of a table that has predefined columns and rows for specific types of data.
Using this format helps users capture and record all needed data. It makes data easier to combine and analyze across projects. Also, the table format makes data easy to search and sort. This makes it faster to find specific data.
Check here specific information for templates management: Results tables
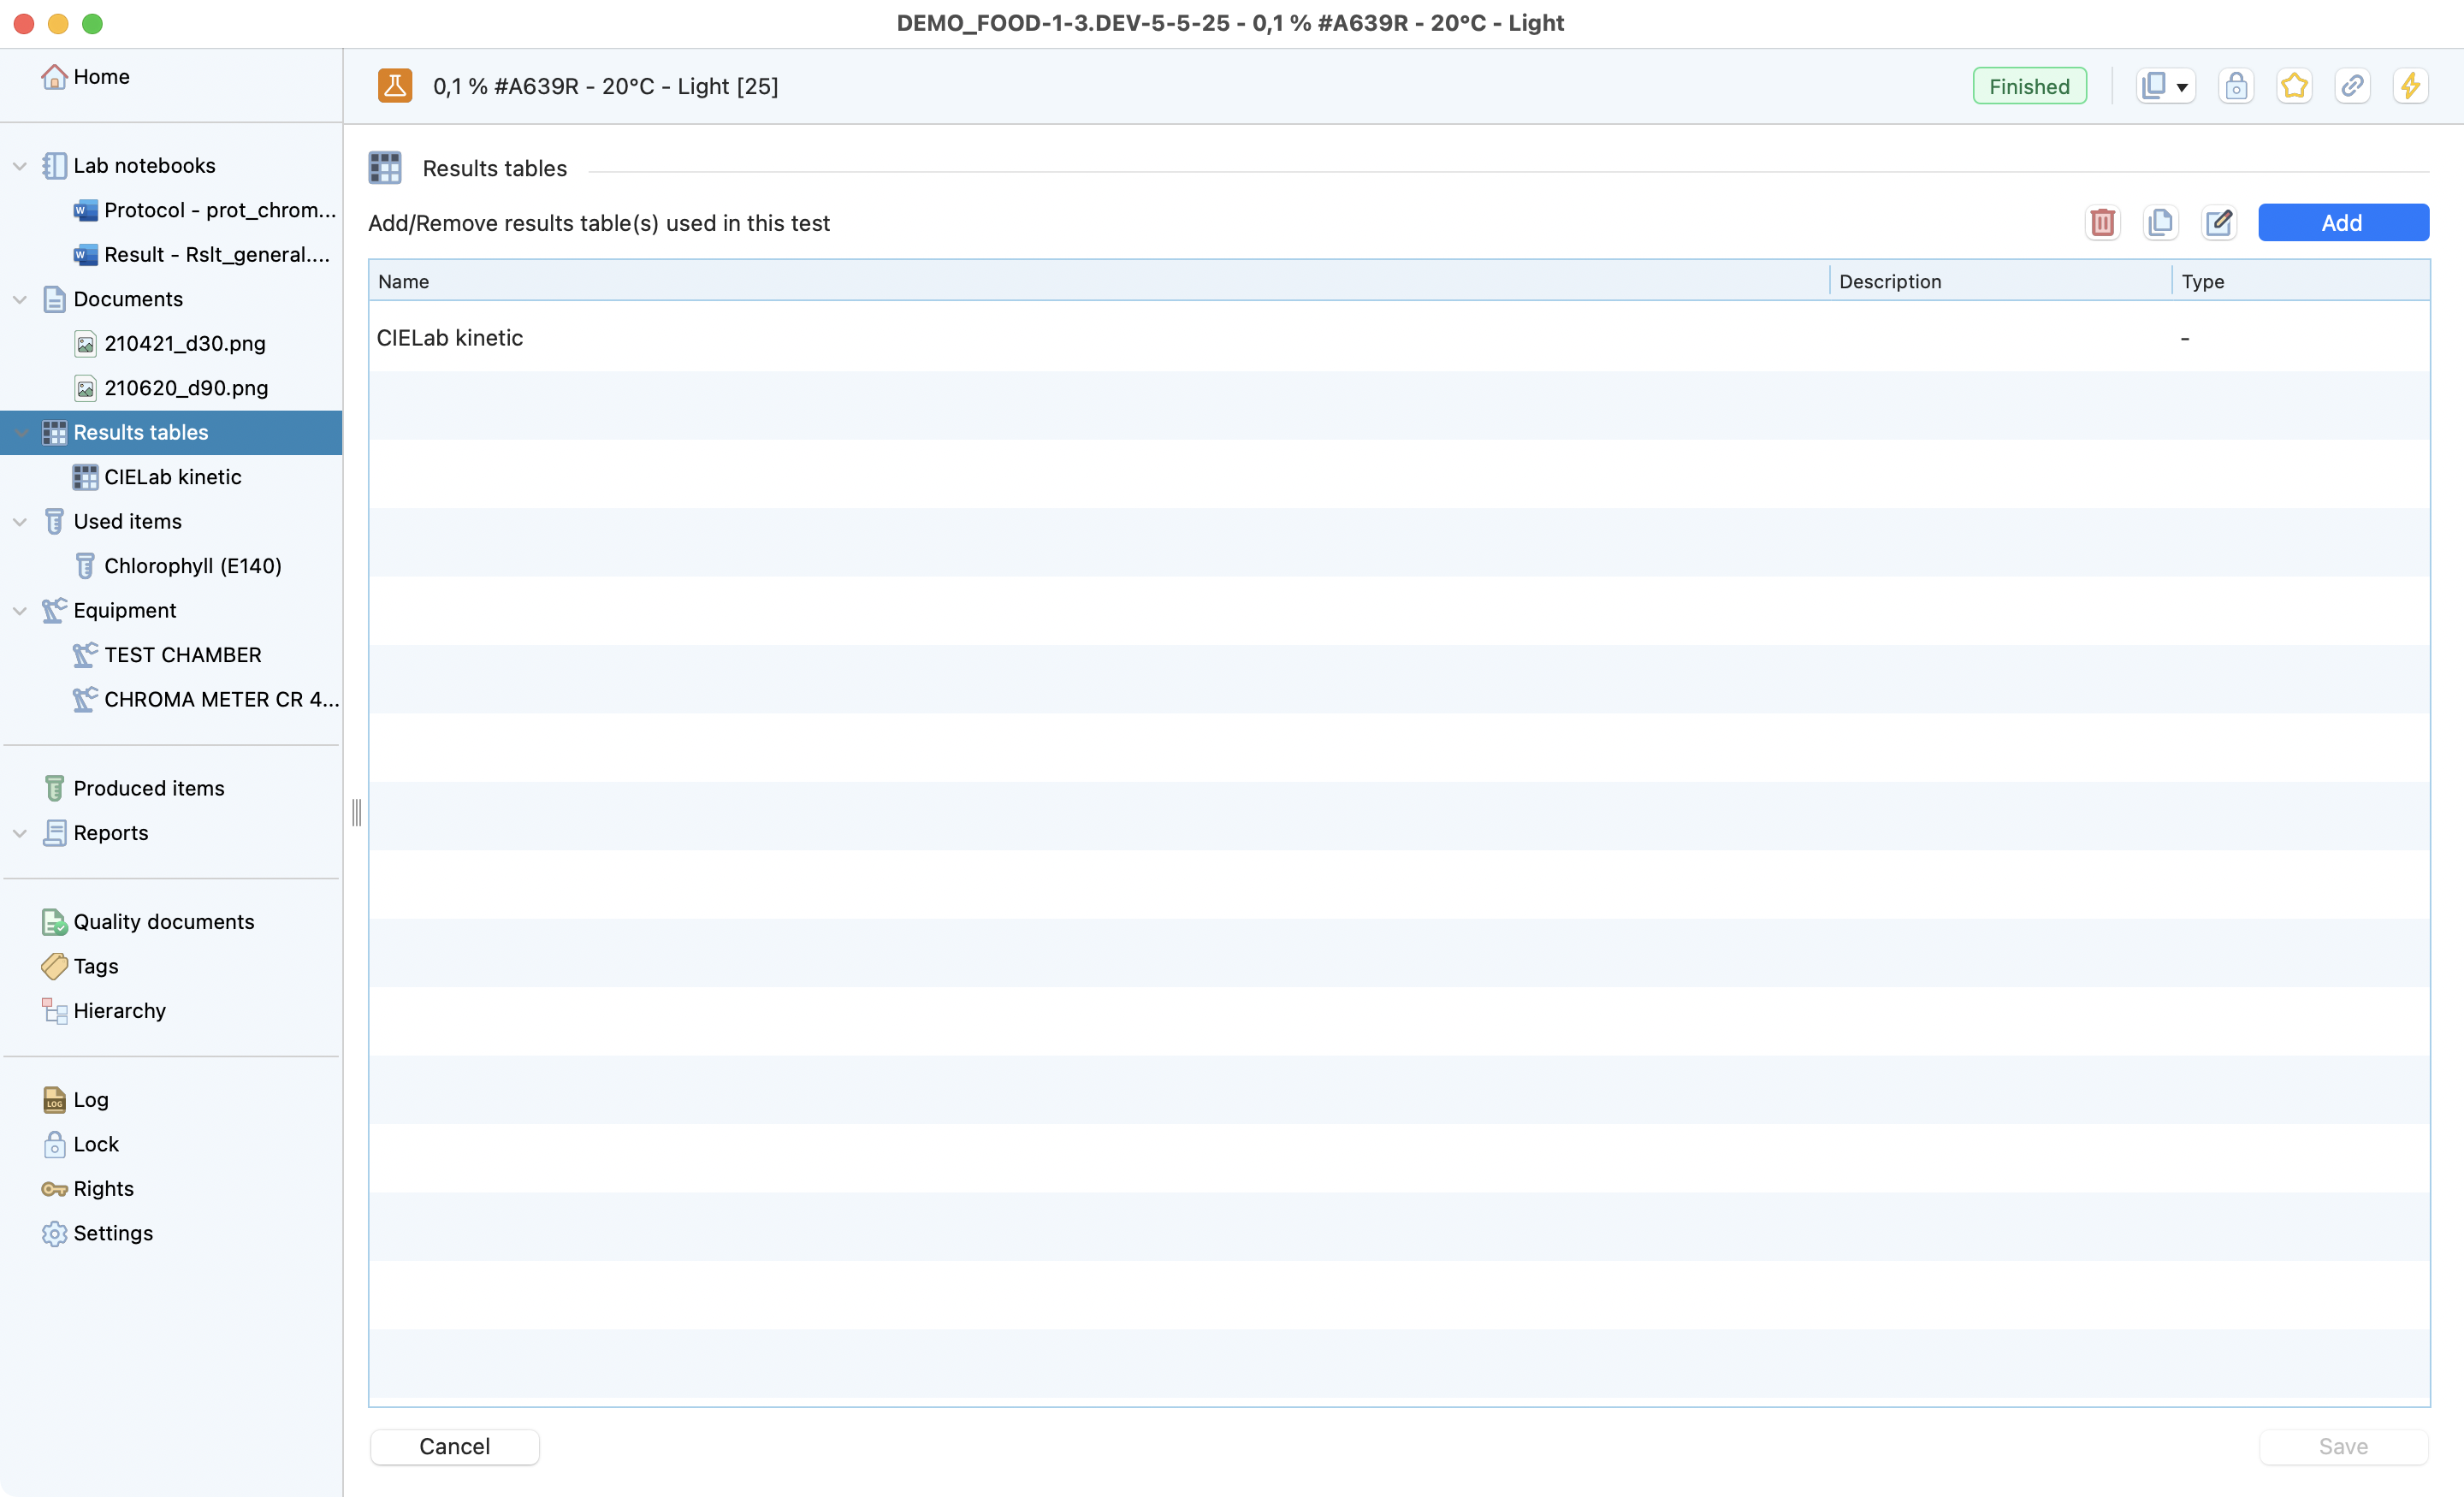
Table results view, with buttons to add, edit, duplicate and delete a new table.
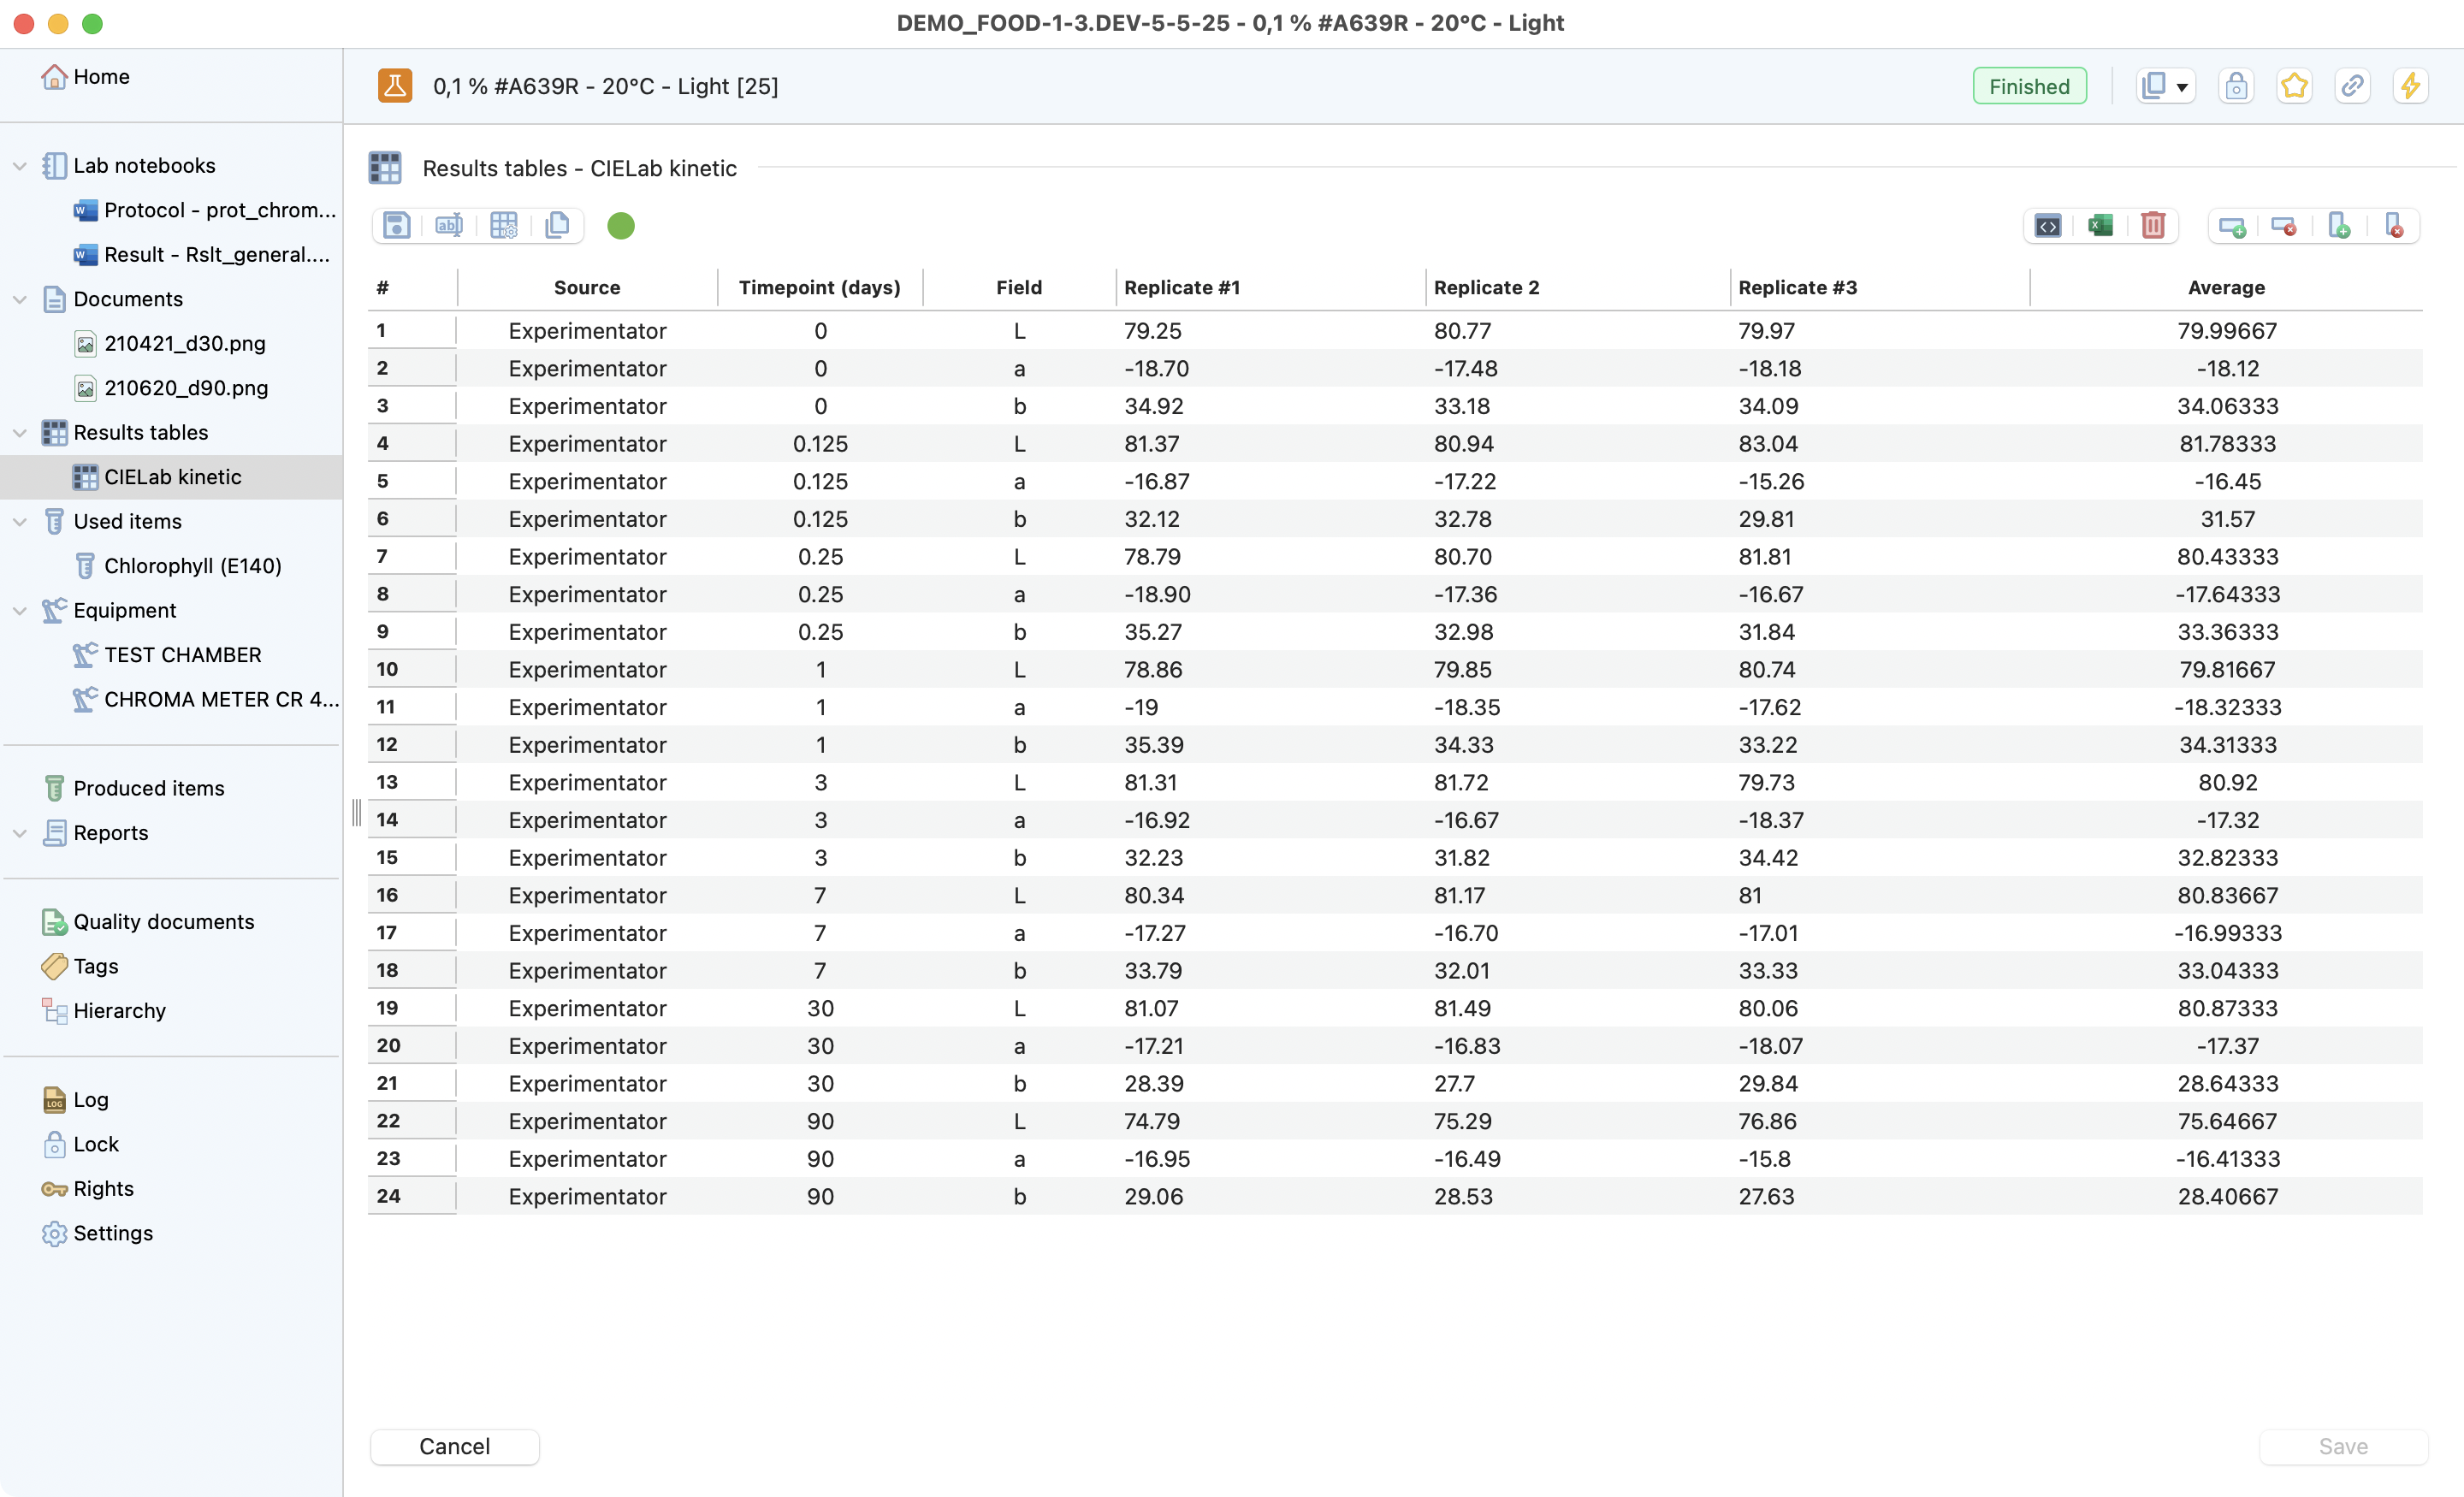
Filled table result. With all the actions in evidence.
Items
By simply specifying which items have been used during your test, you save time by eliminating the need for manual tracking and record-keeping.
And as it is directly linked from your stock inventory, it:
Eliminates the risk of human error in data entry.
Directly updates your remaining stock quantities.
Saves valuable time that can be used for more important tasks.
With this feature, users can be sure that they are keeping the traceability and integrity of their data. Also speeding up their workflow.
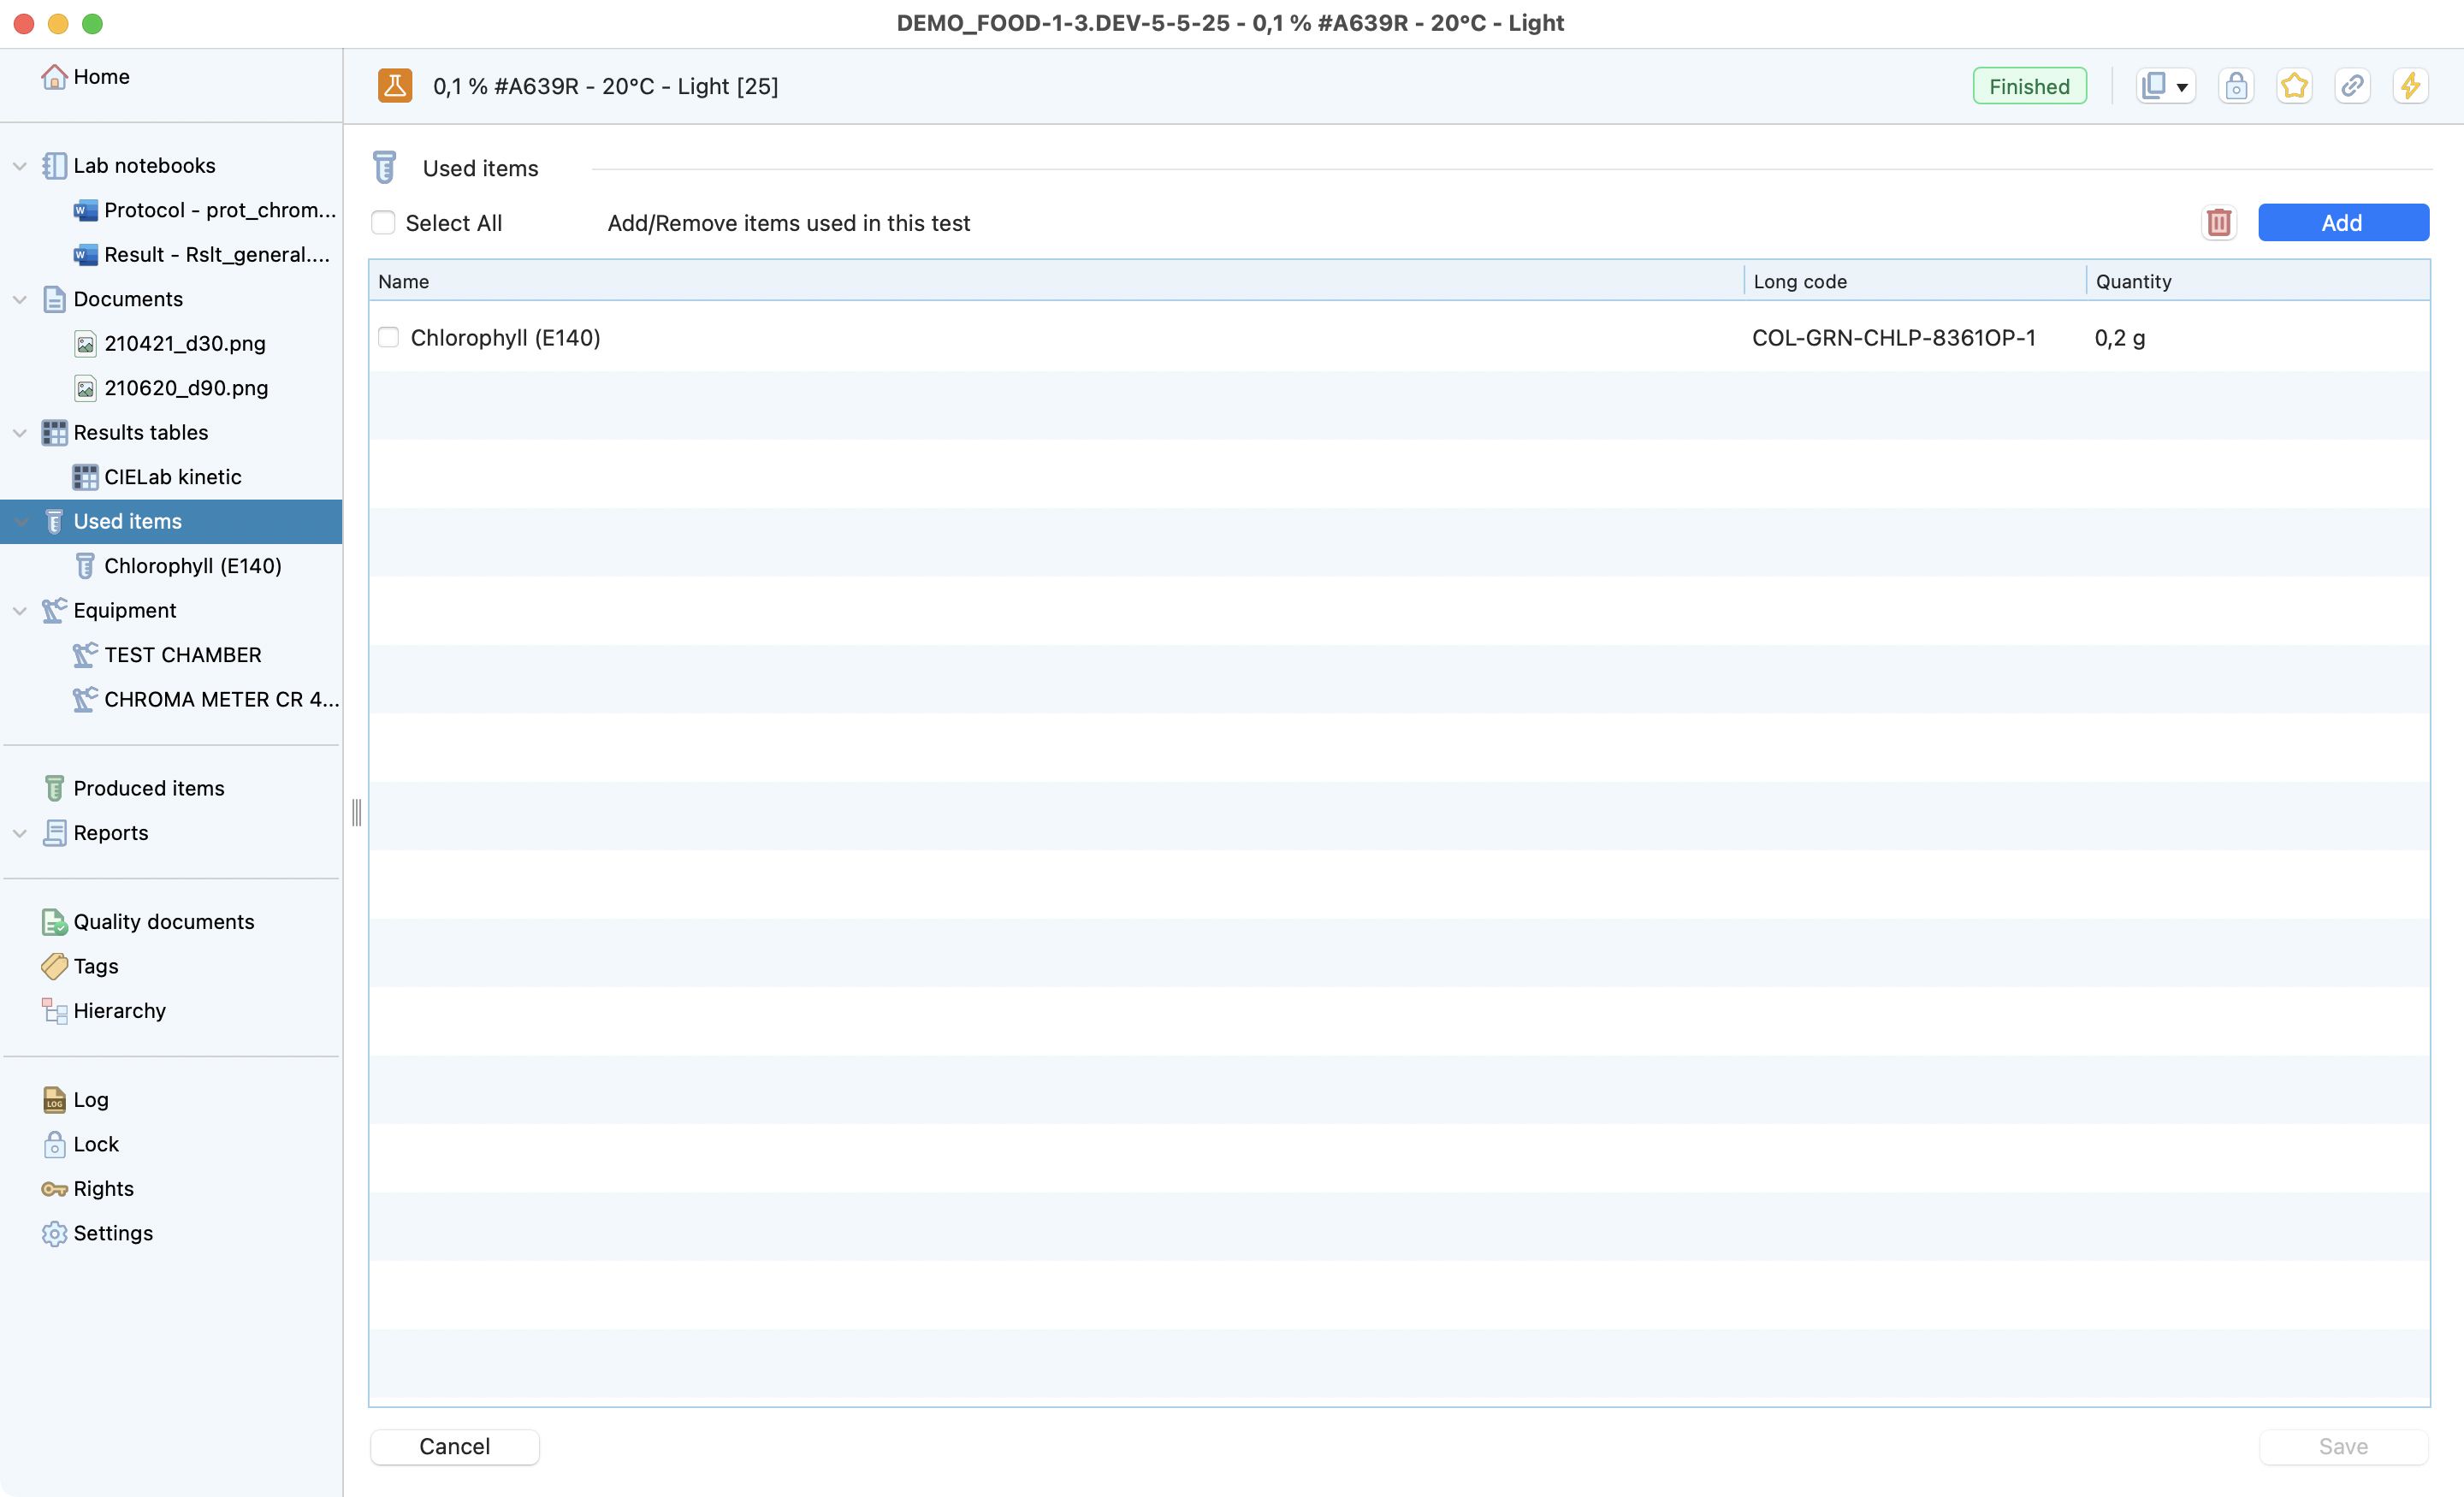
View of the items page.
To add items on your test
Here it is the 4 steps to link an item:
After having clicked on the Add button, you can directly scan the QR code of the item, or open the items you want to add to your test on the picker.
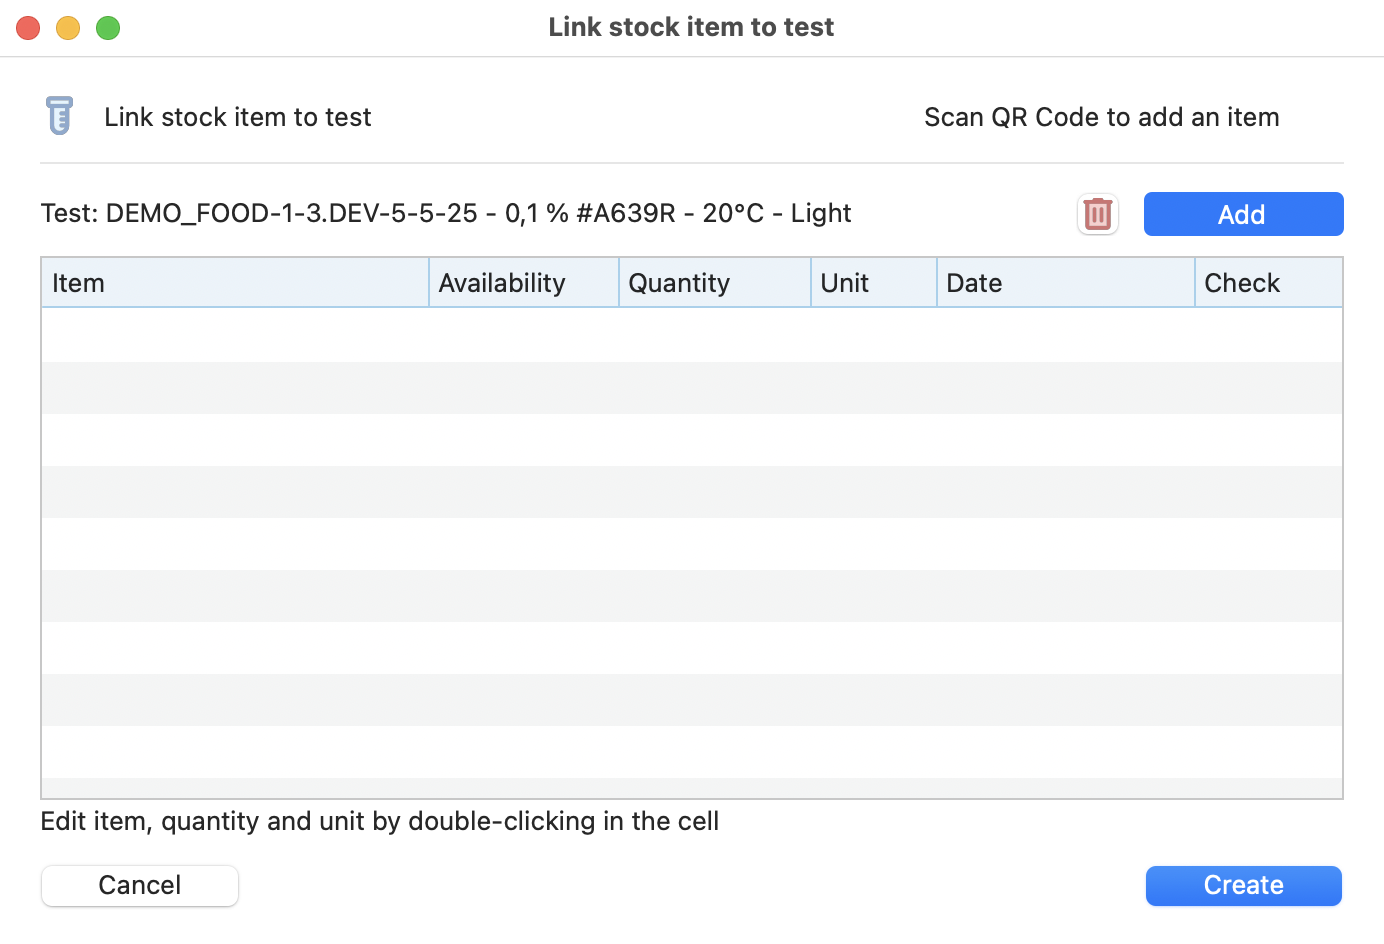
View of test-item link window.
If you click on the Add button, a new window will open to select manually the items you want to add.
Window displayed after selecting Add item.
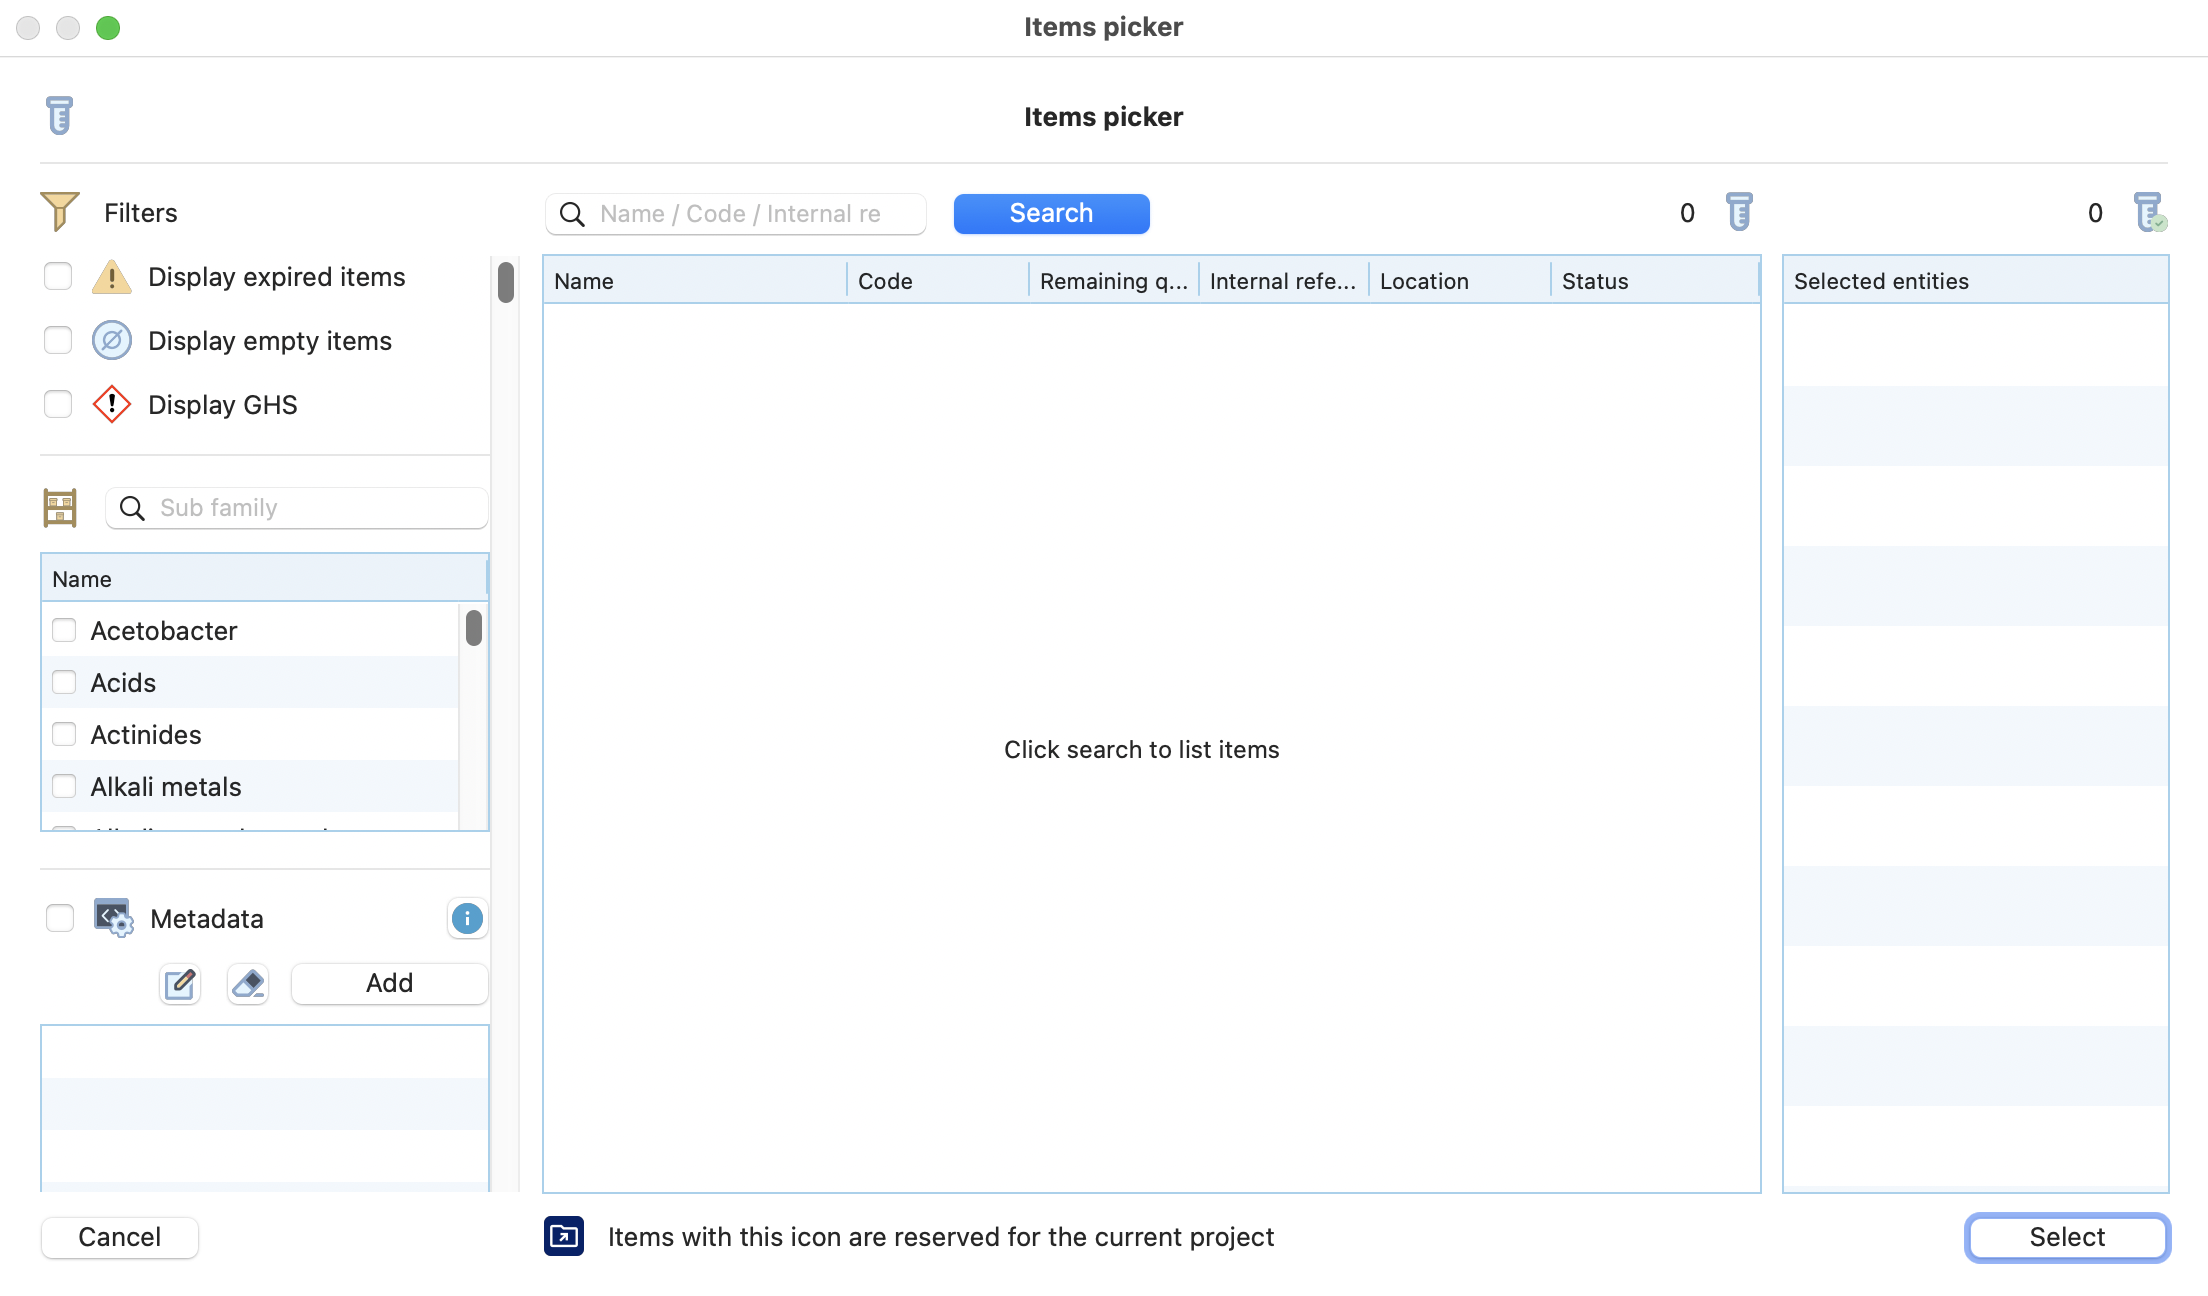
Use filters to find your items and see remaining quantities:
Subfamily;
Product name, code, batch code, etc.
Eventually display expired and/or empty items.
Then validate your selection.
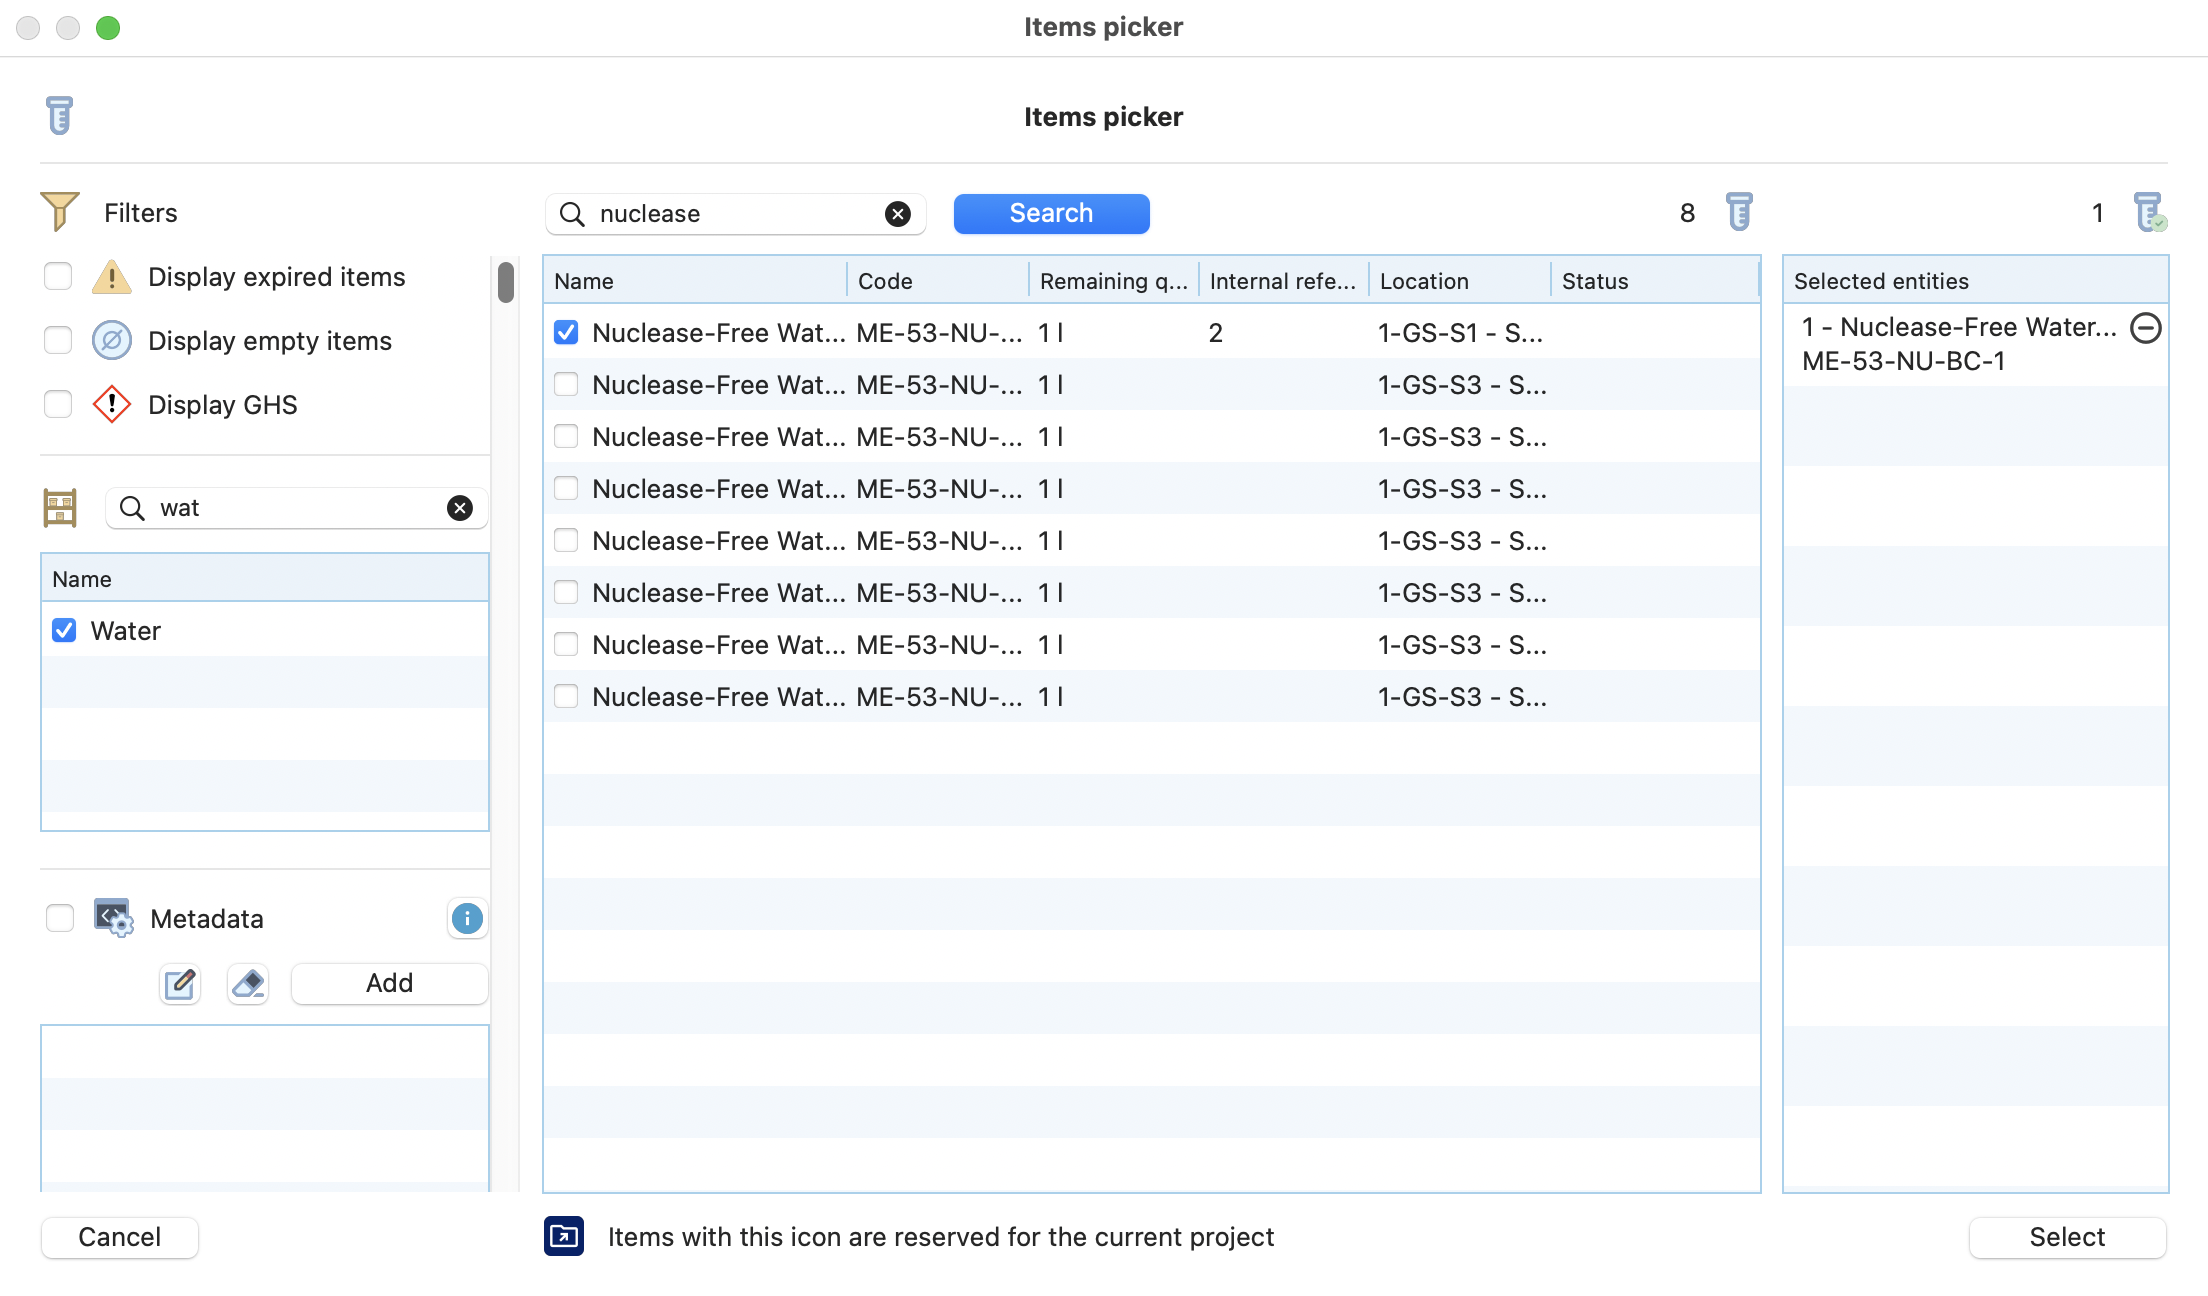
View of the items picker
Define quantities used for each item, review the date and validate.
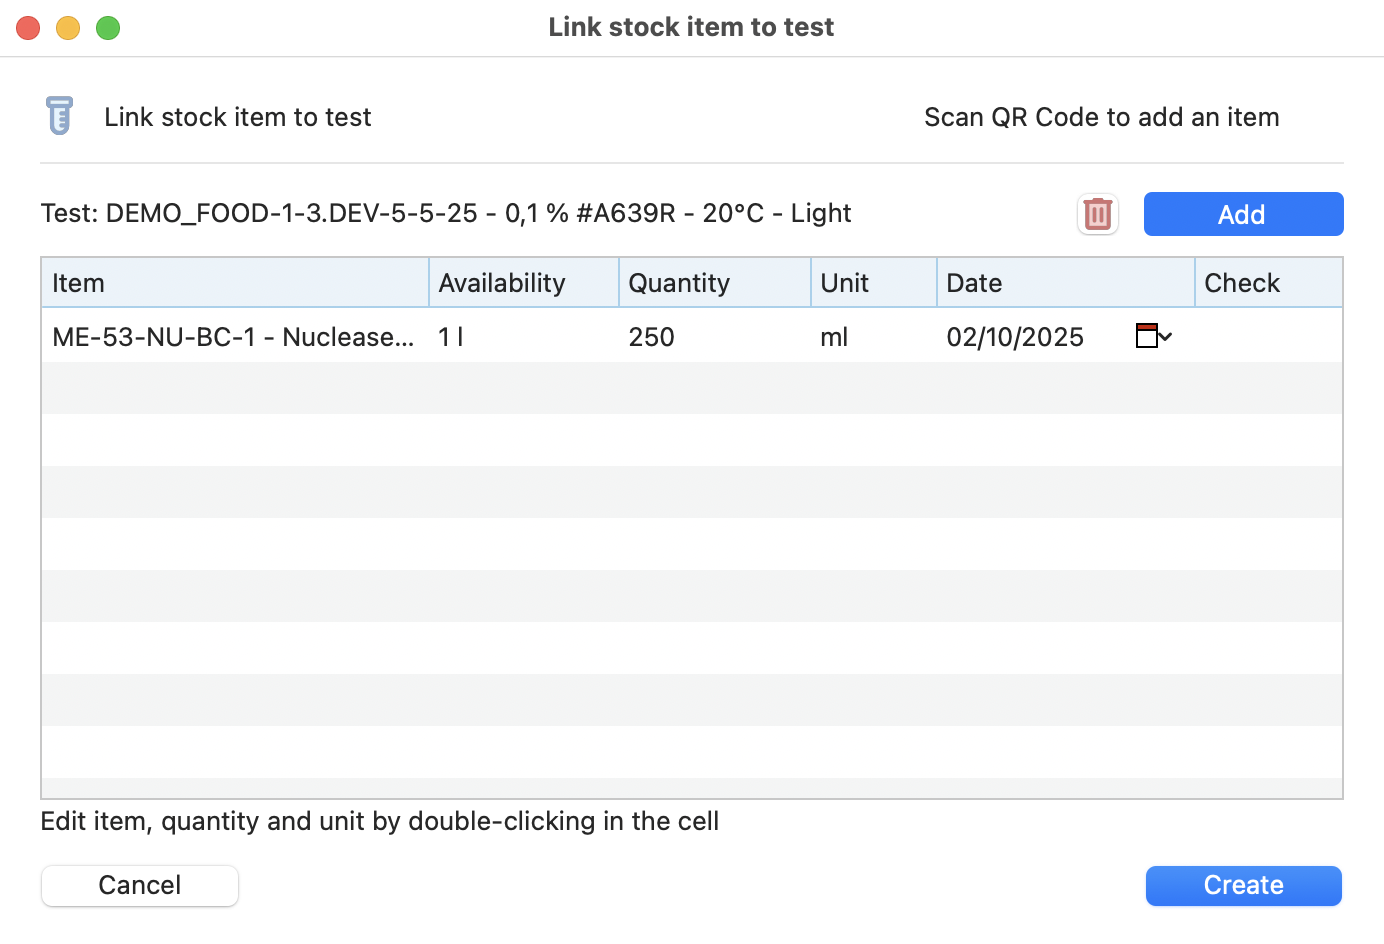
Resume of the item(s) to be linked
The link has been performed, the quantity of the item in stock reduced accordingly, and the traceability of the item in the test ensured.
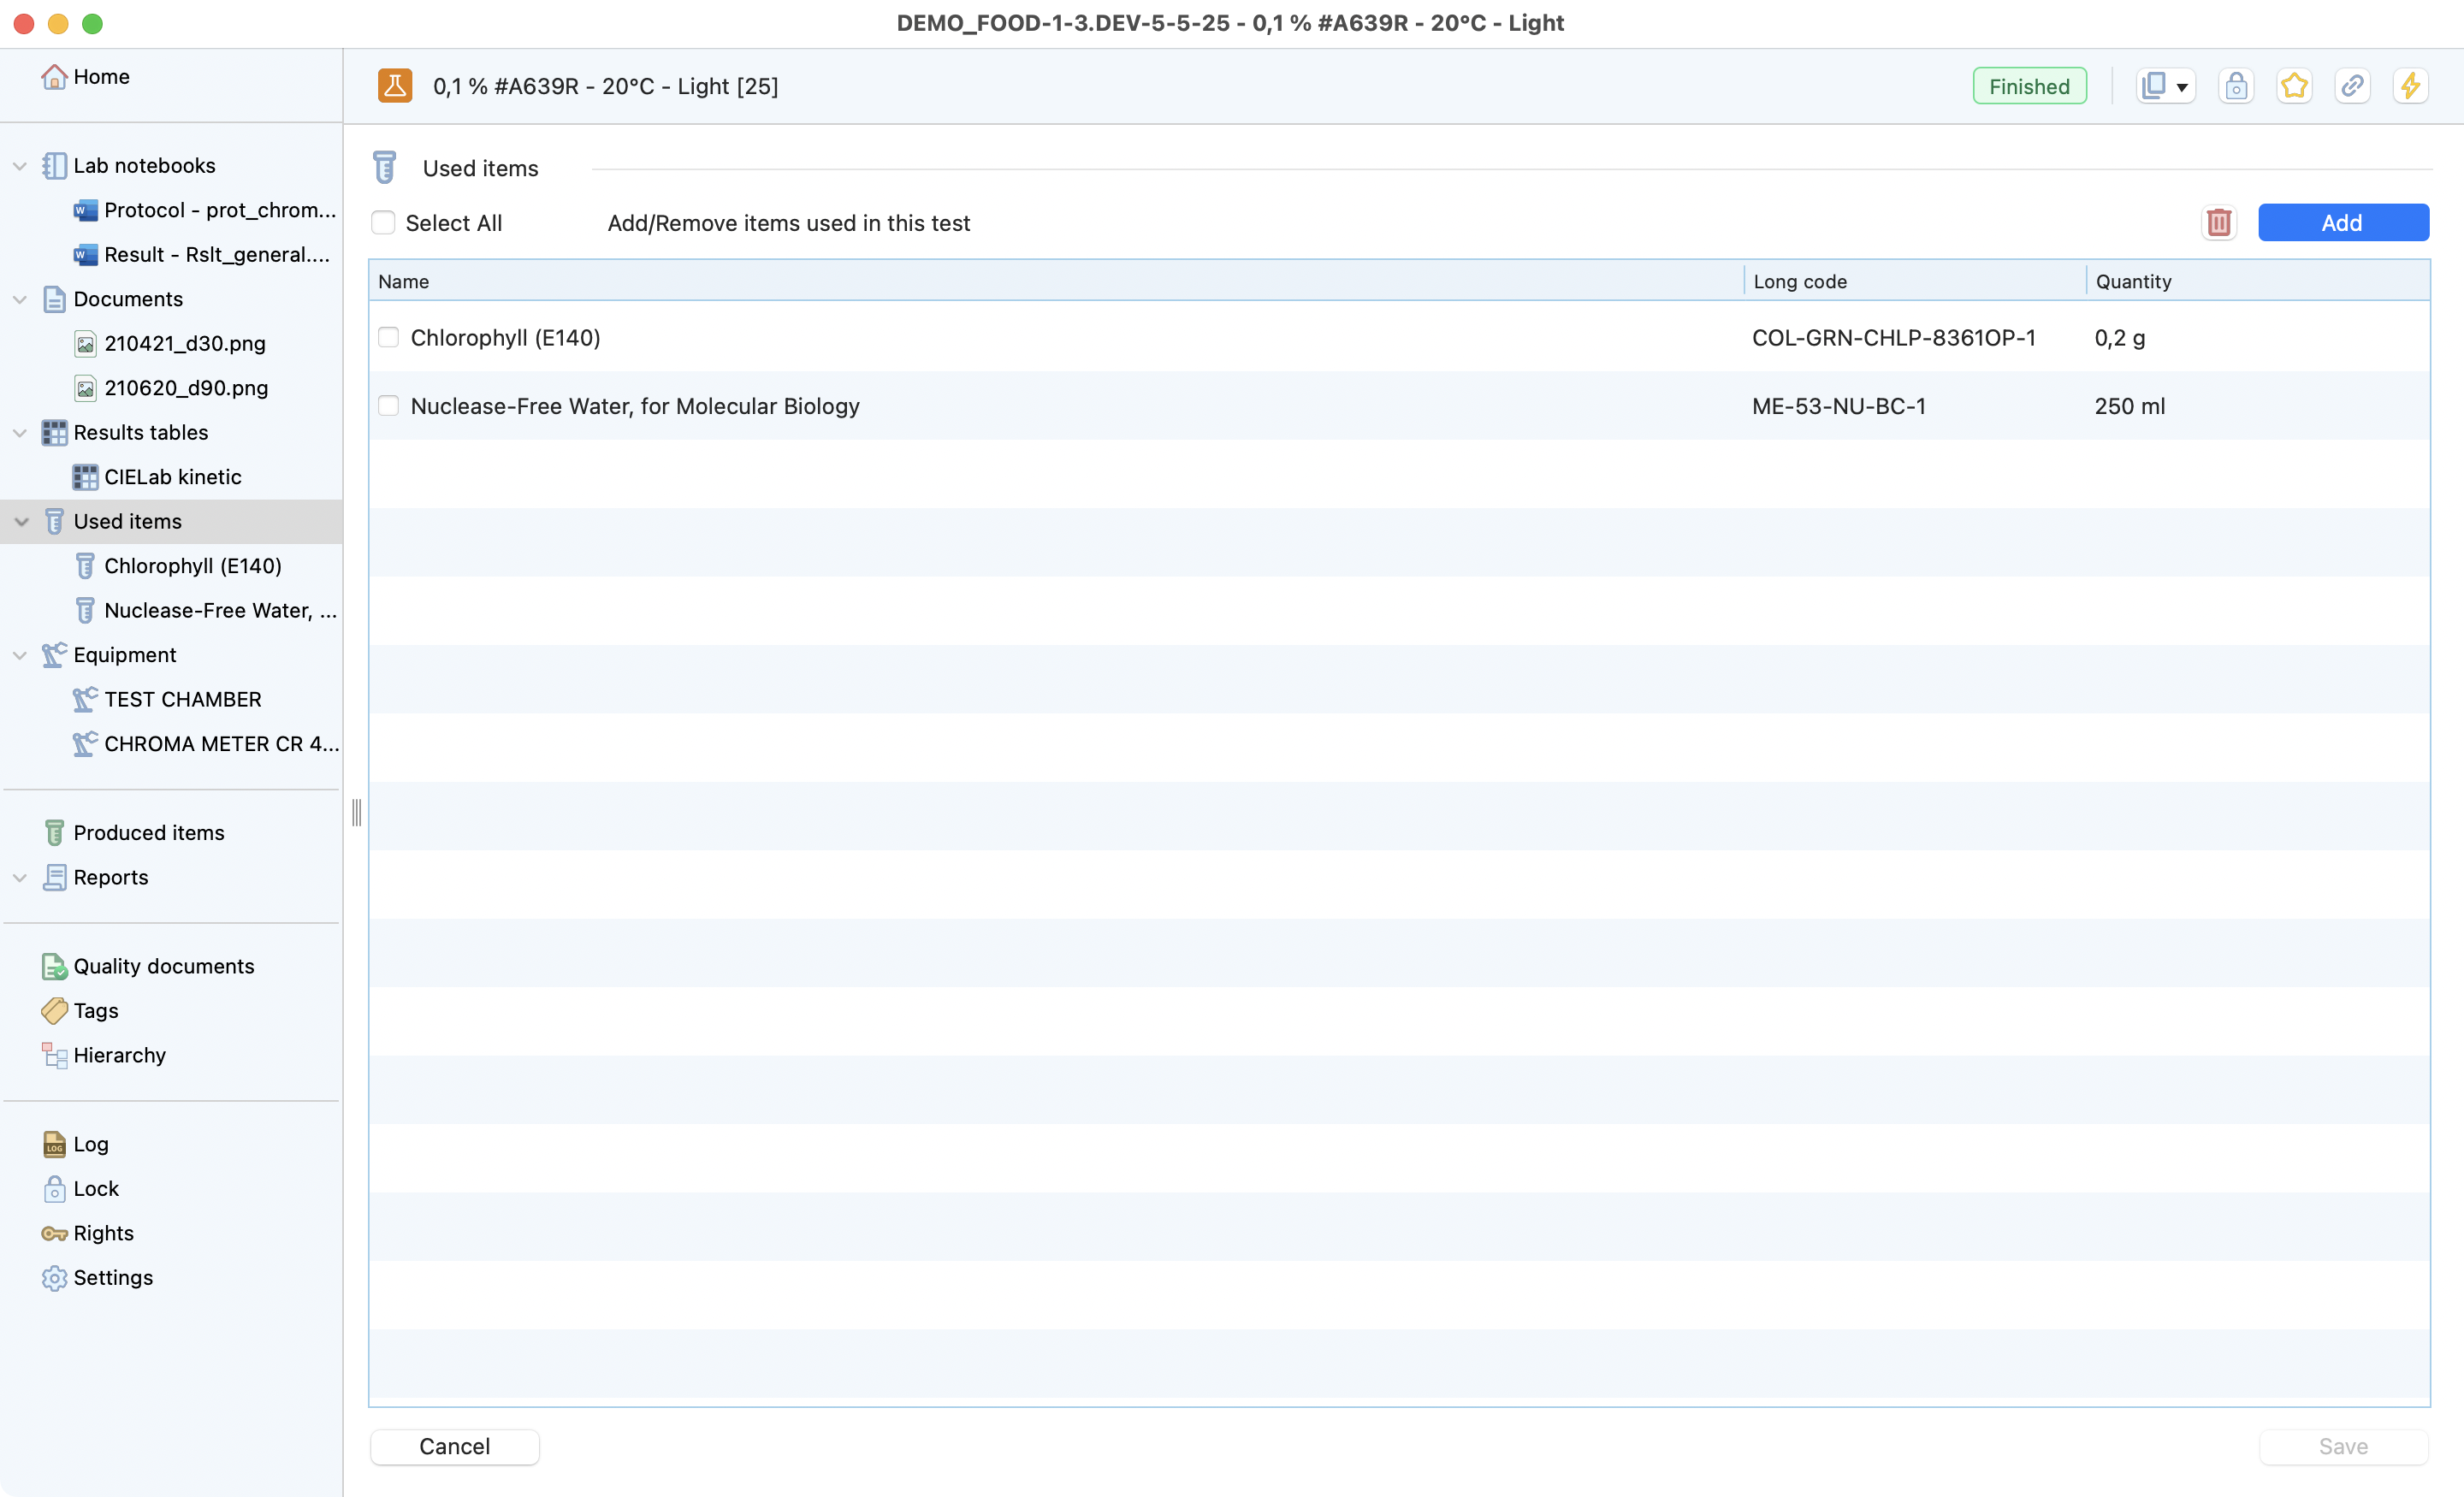
Newly associated item shown in the list
You can click on a specific item to see more details:
Tip
It’s possible to directly go to the stock item by clicking on the show details button for more details.
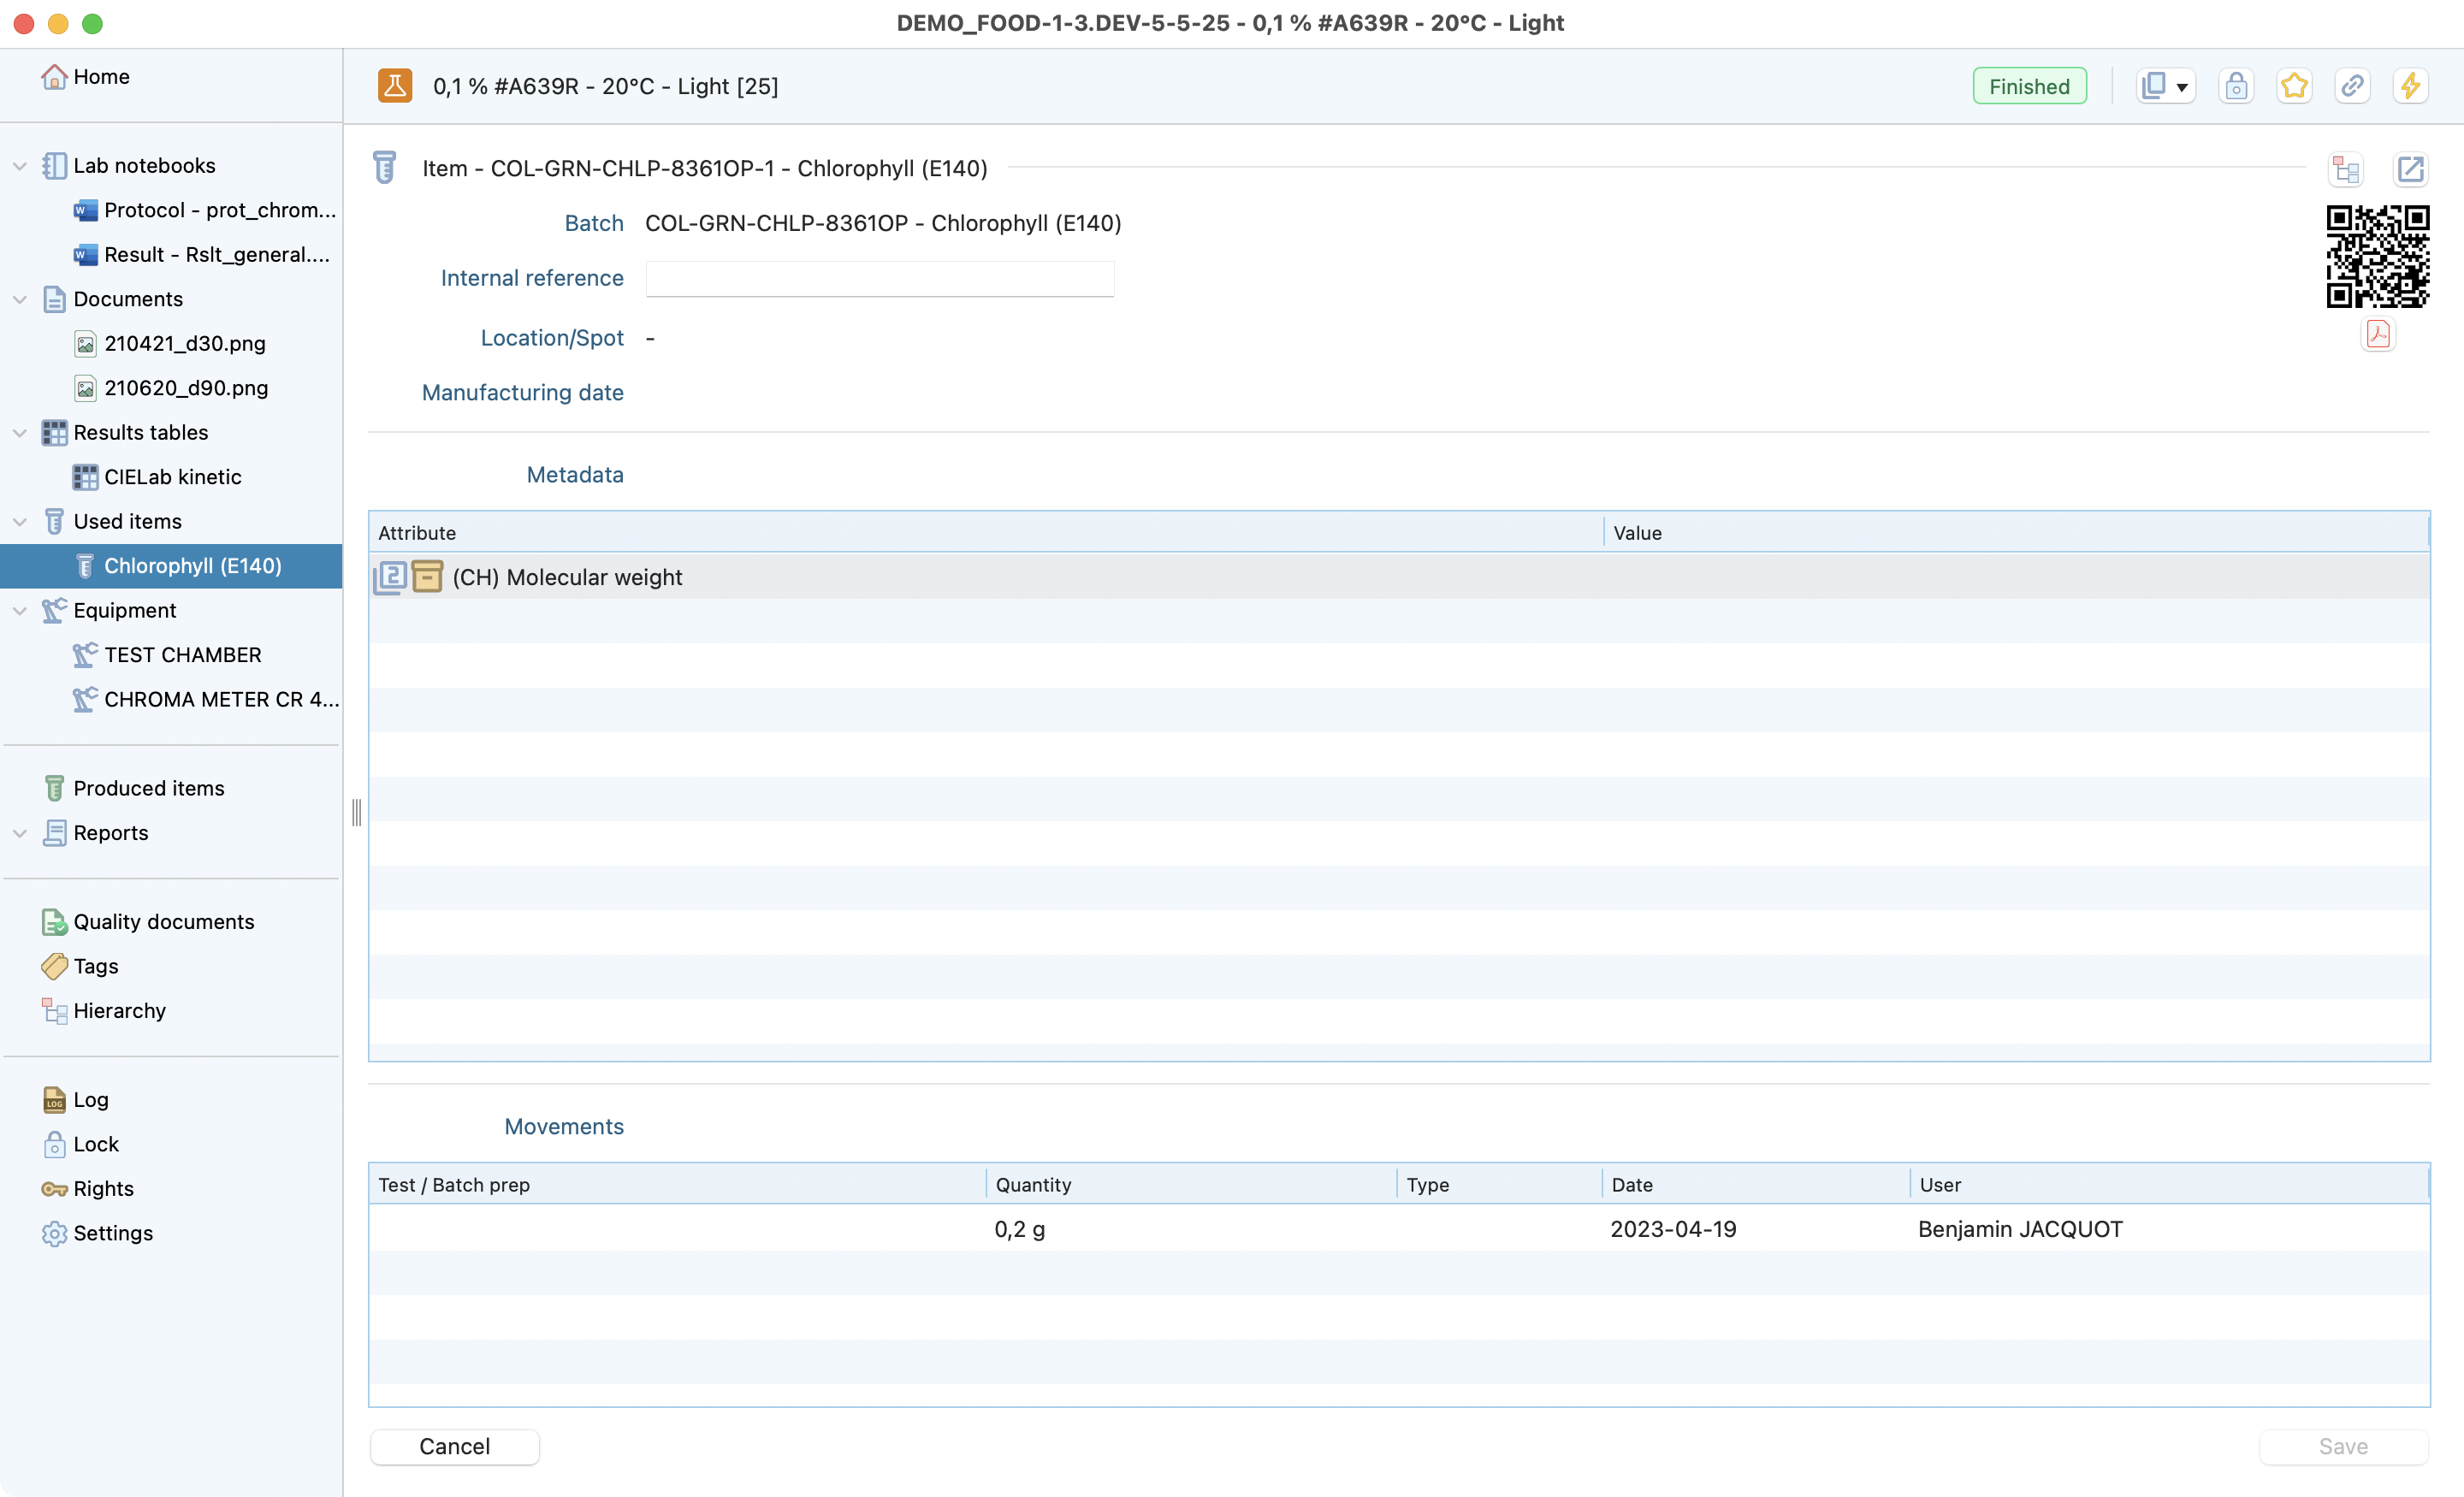
Items page inside a test.
Assets
Similarily to the items, you can specify which equipment has been used, and set your traceability. Here is the 2 steps needed to link an asset to your test:
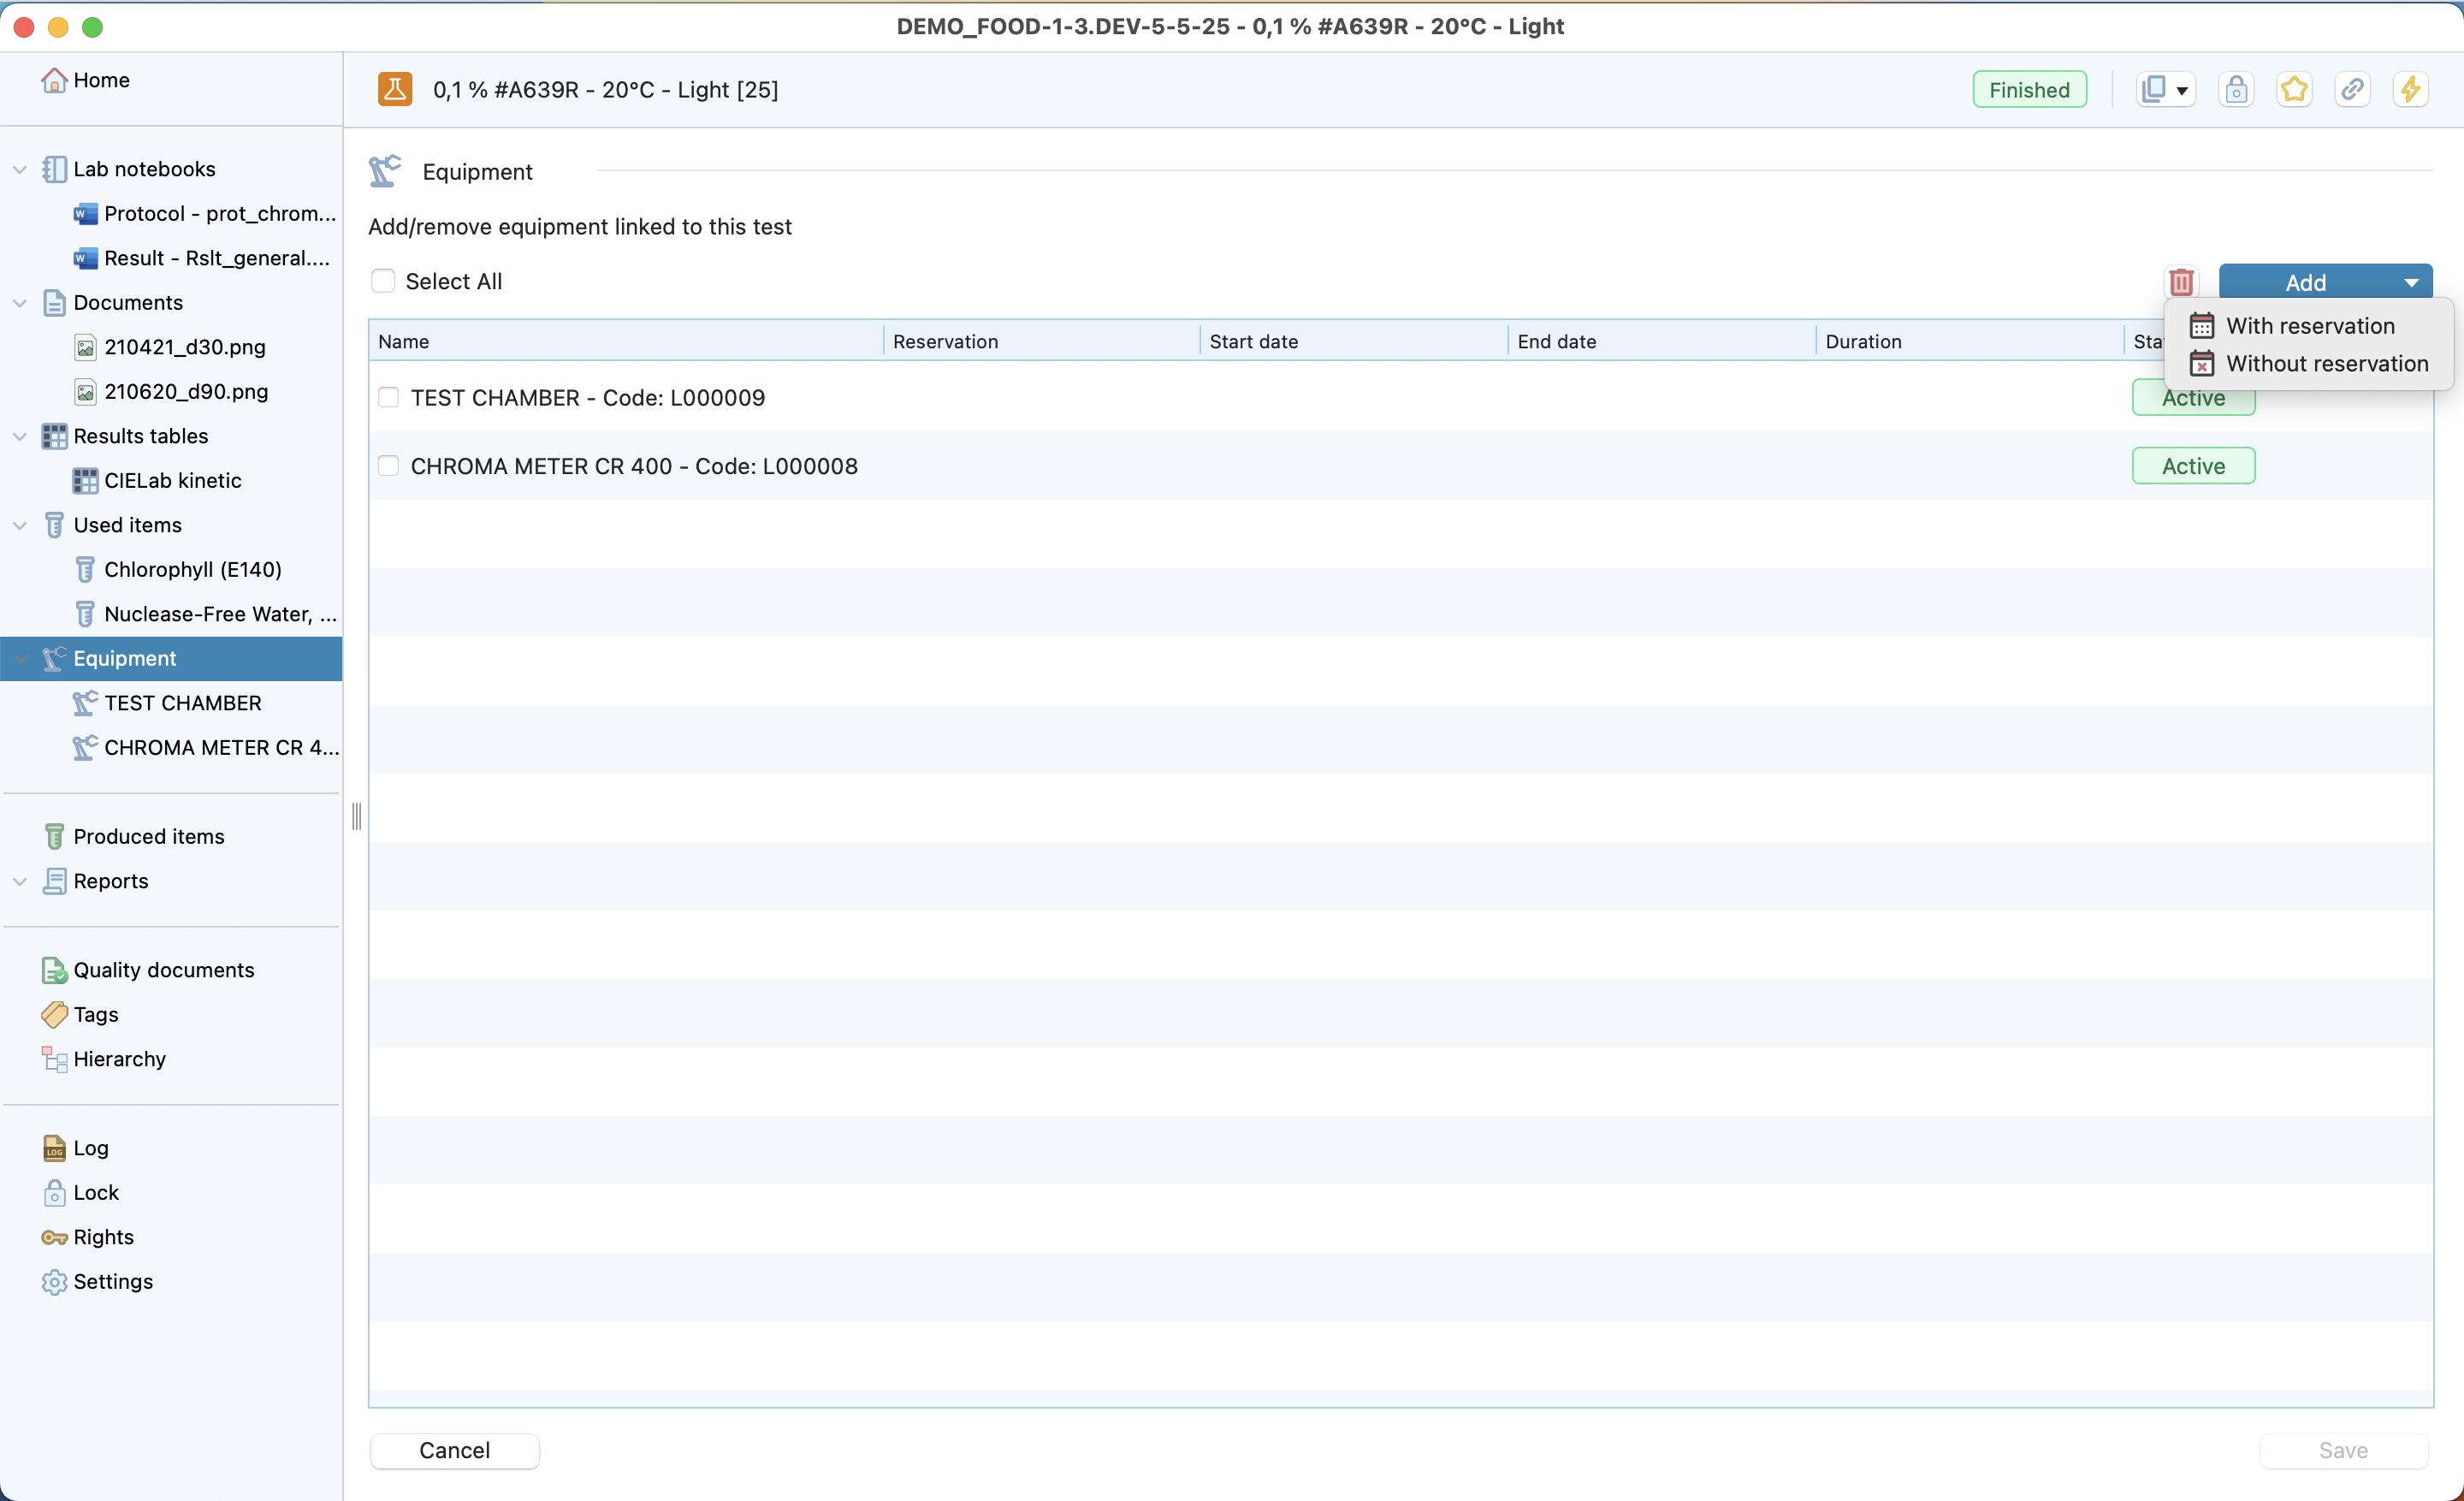
Equipment section inside a test.
Click on the add button and select whether you want to book or not the equipment.
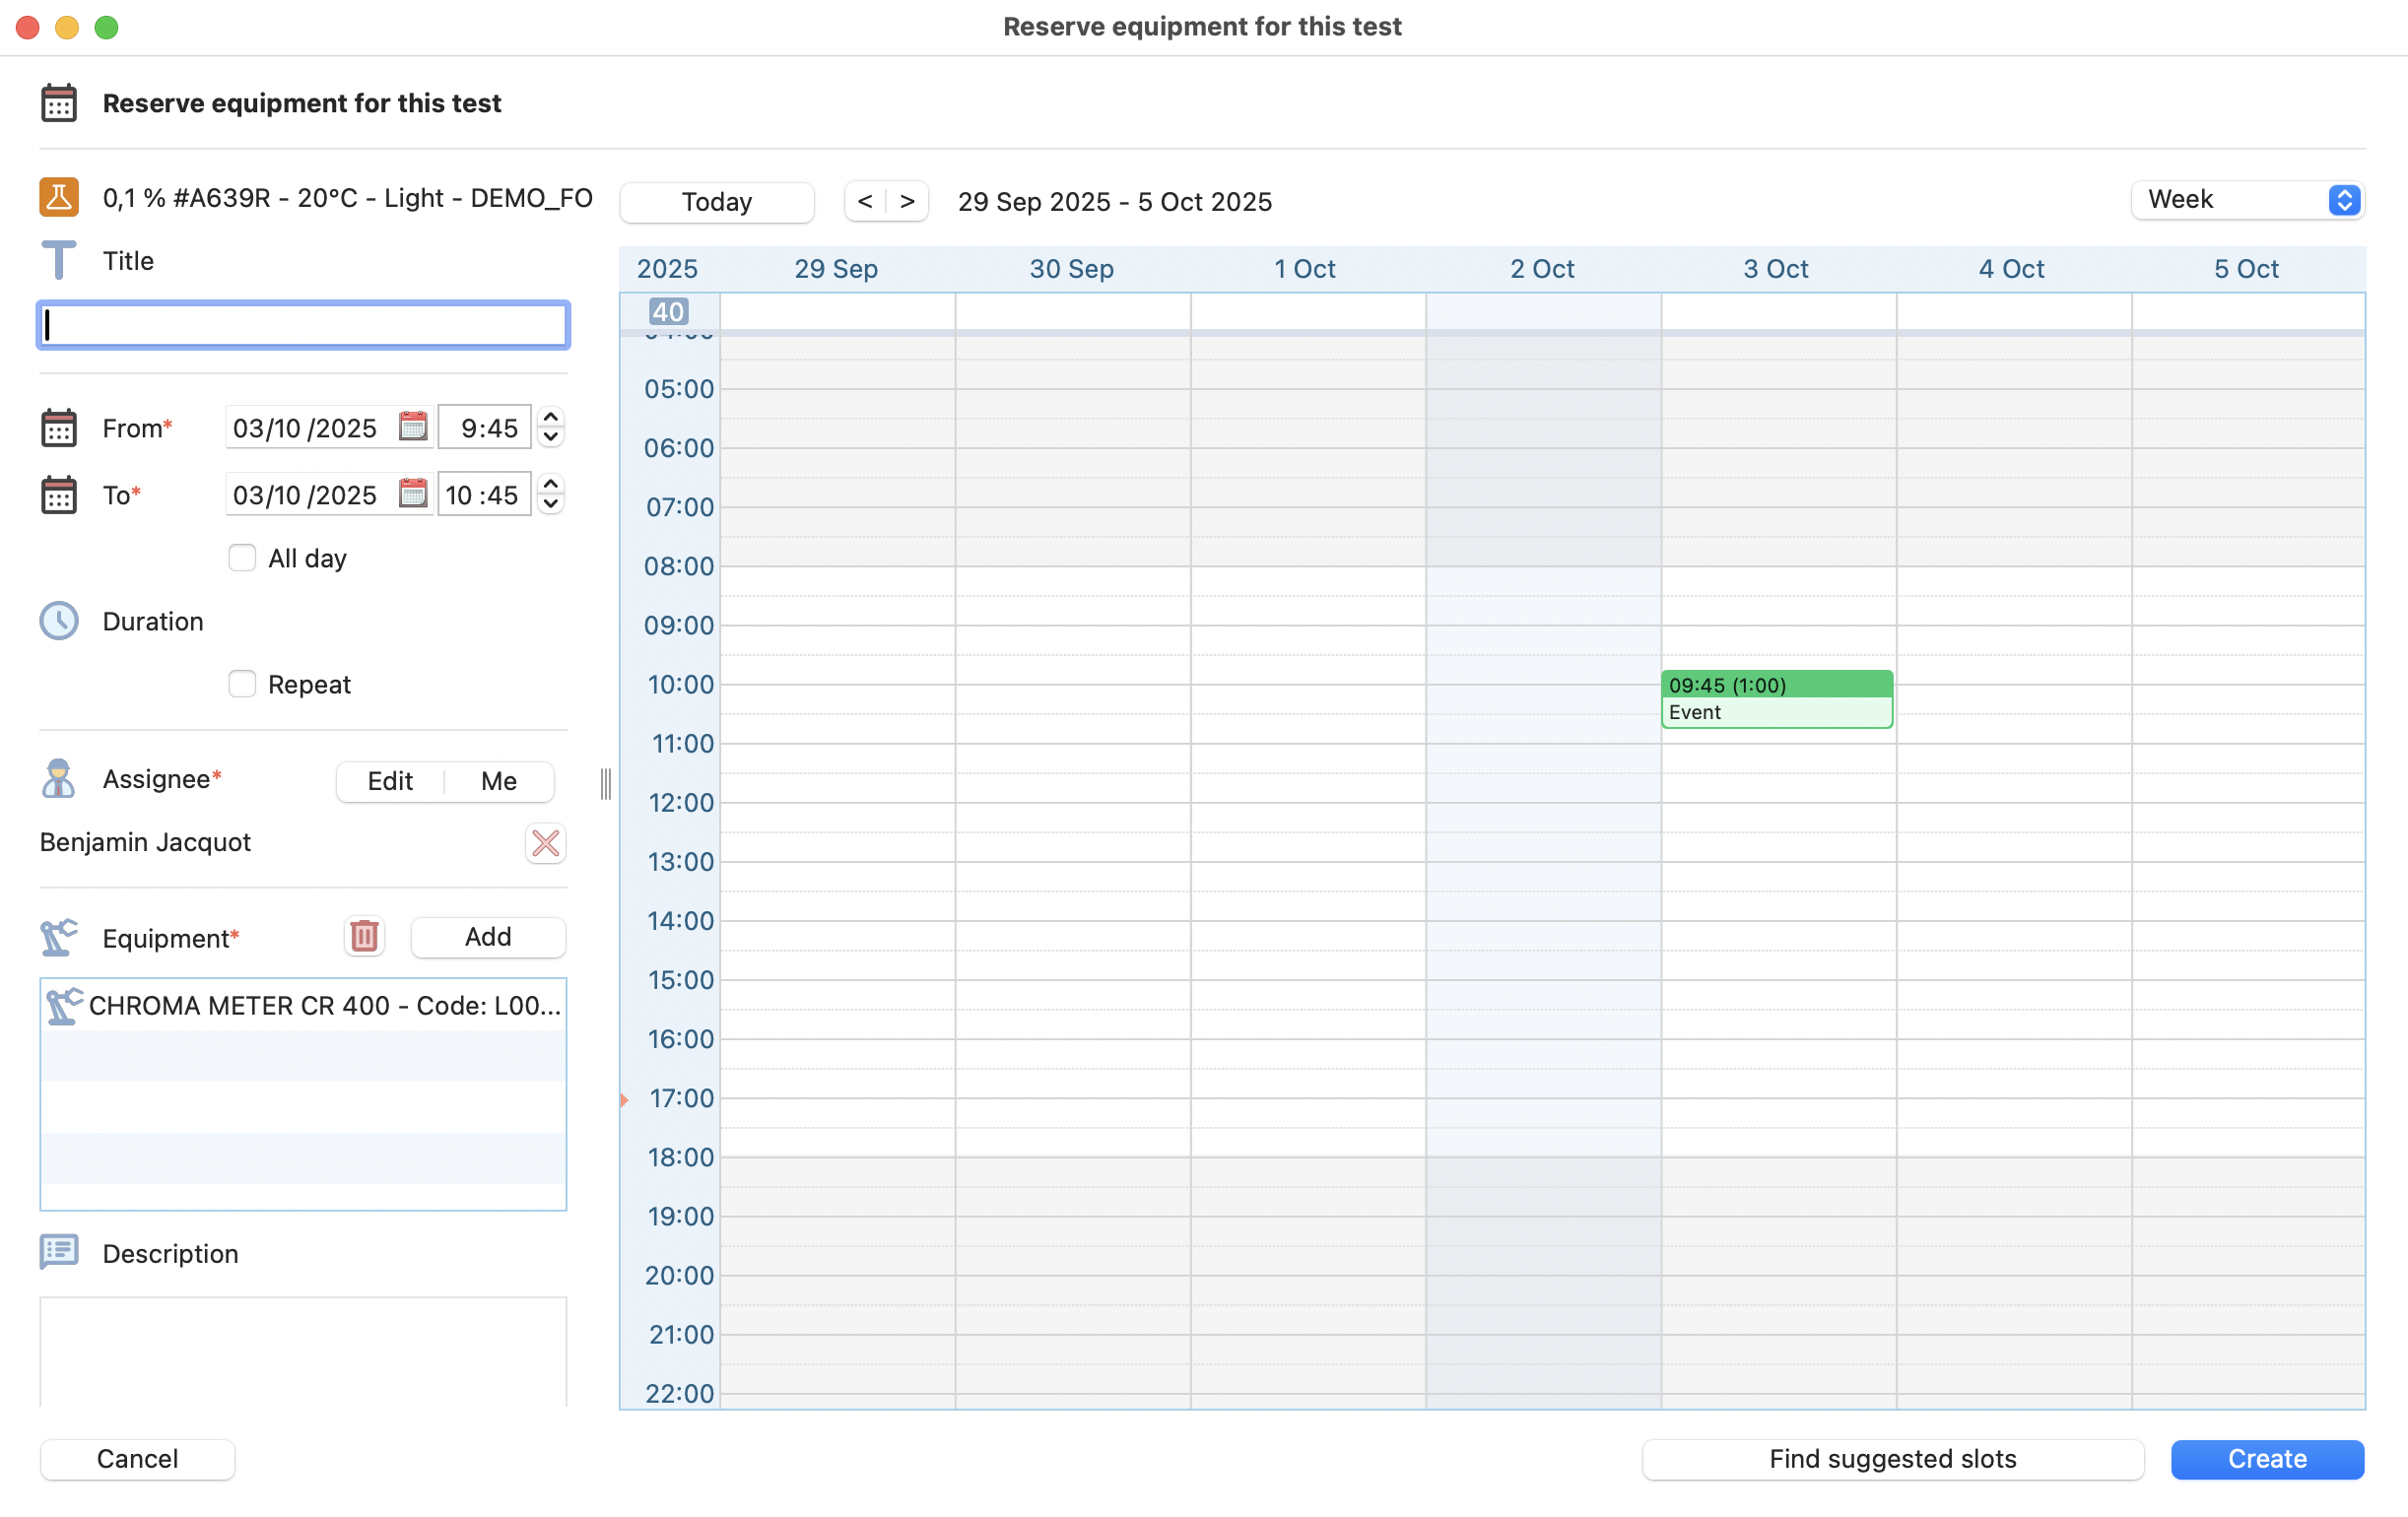
Equipment booking system.
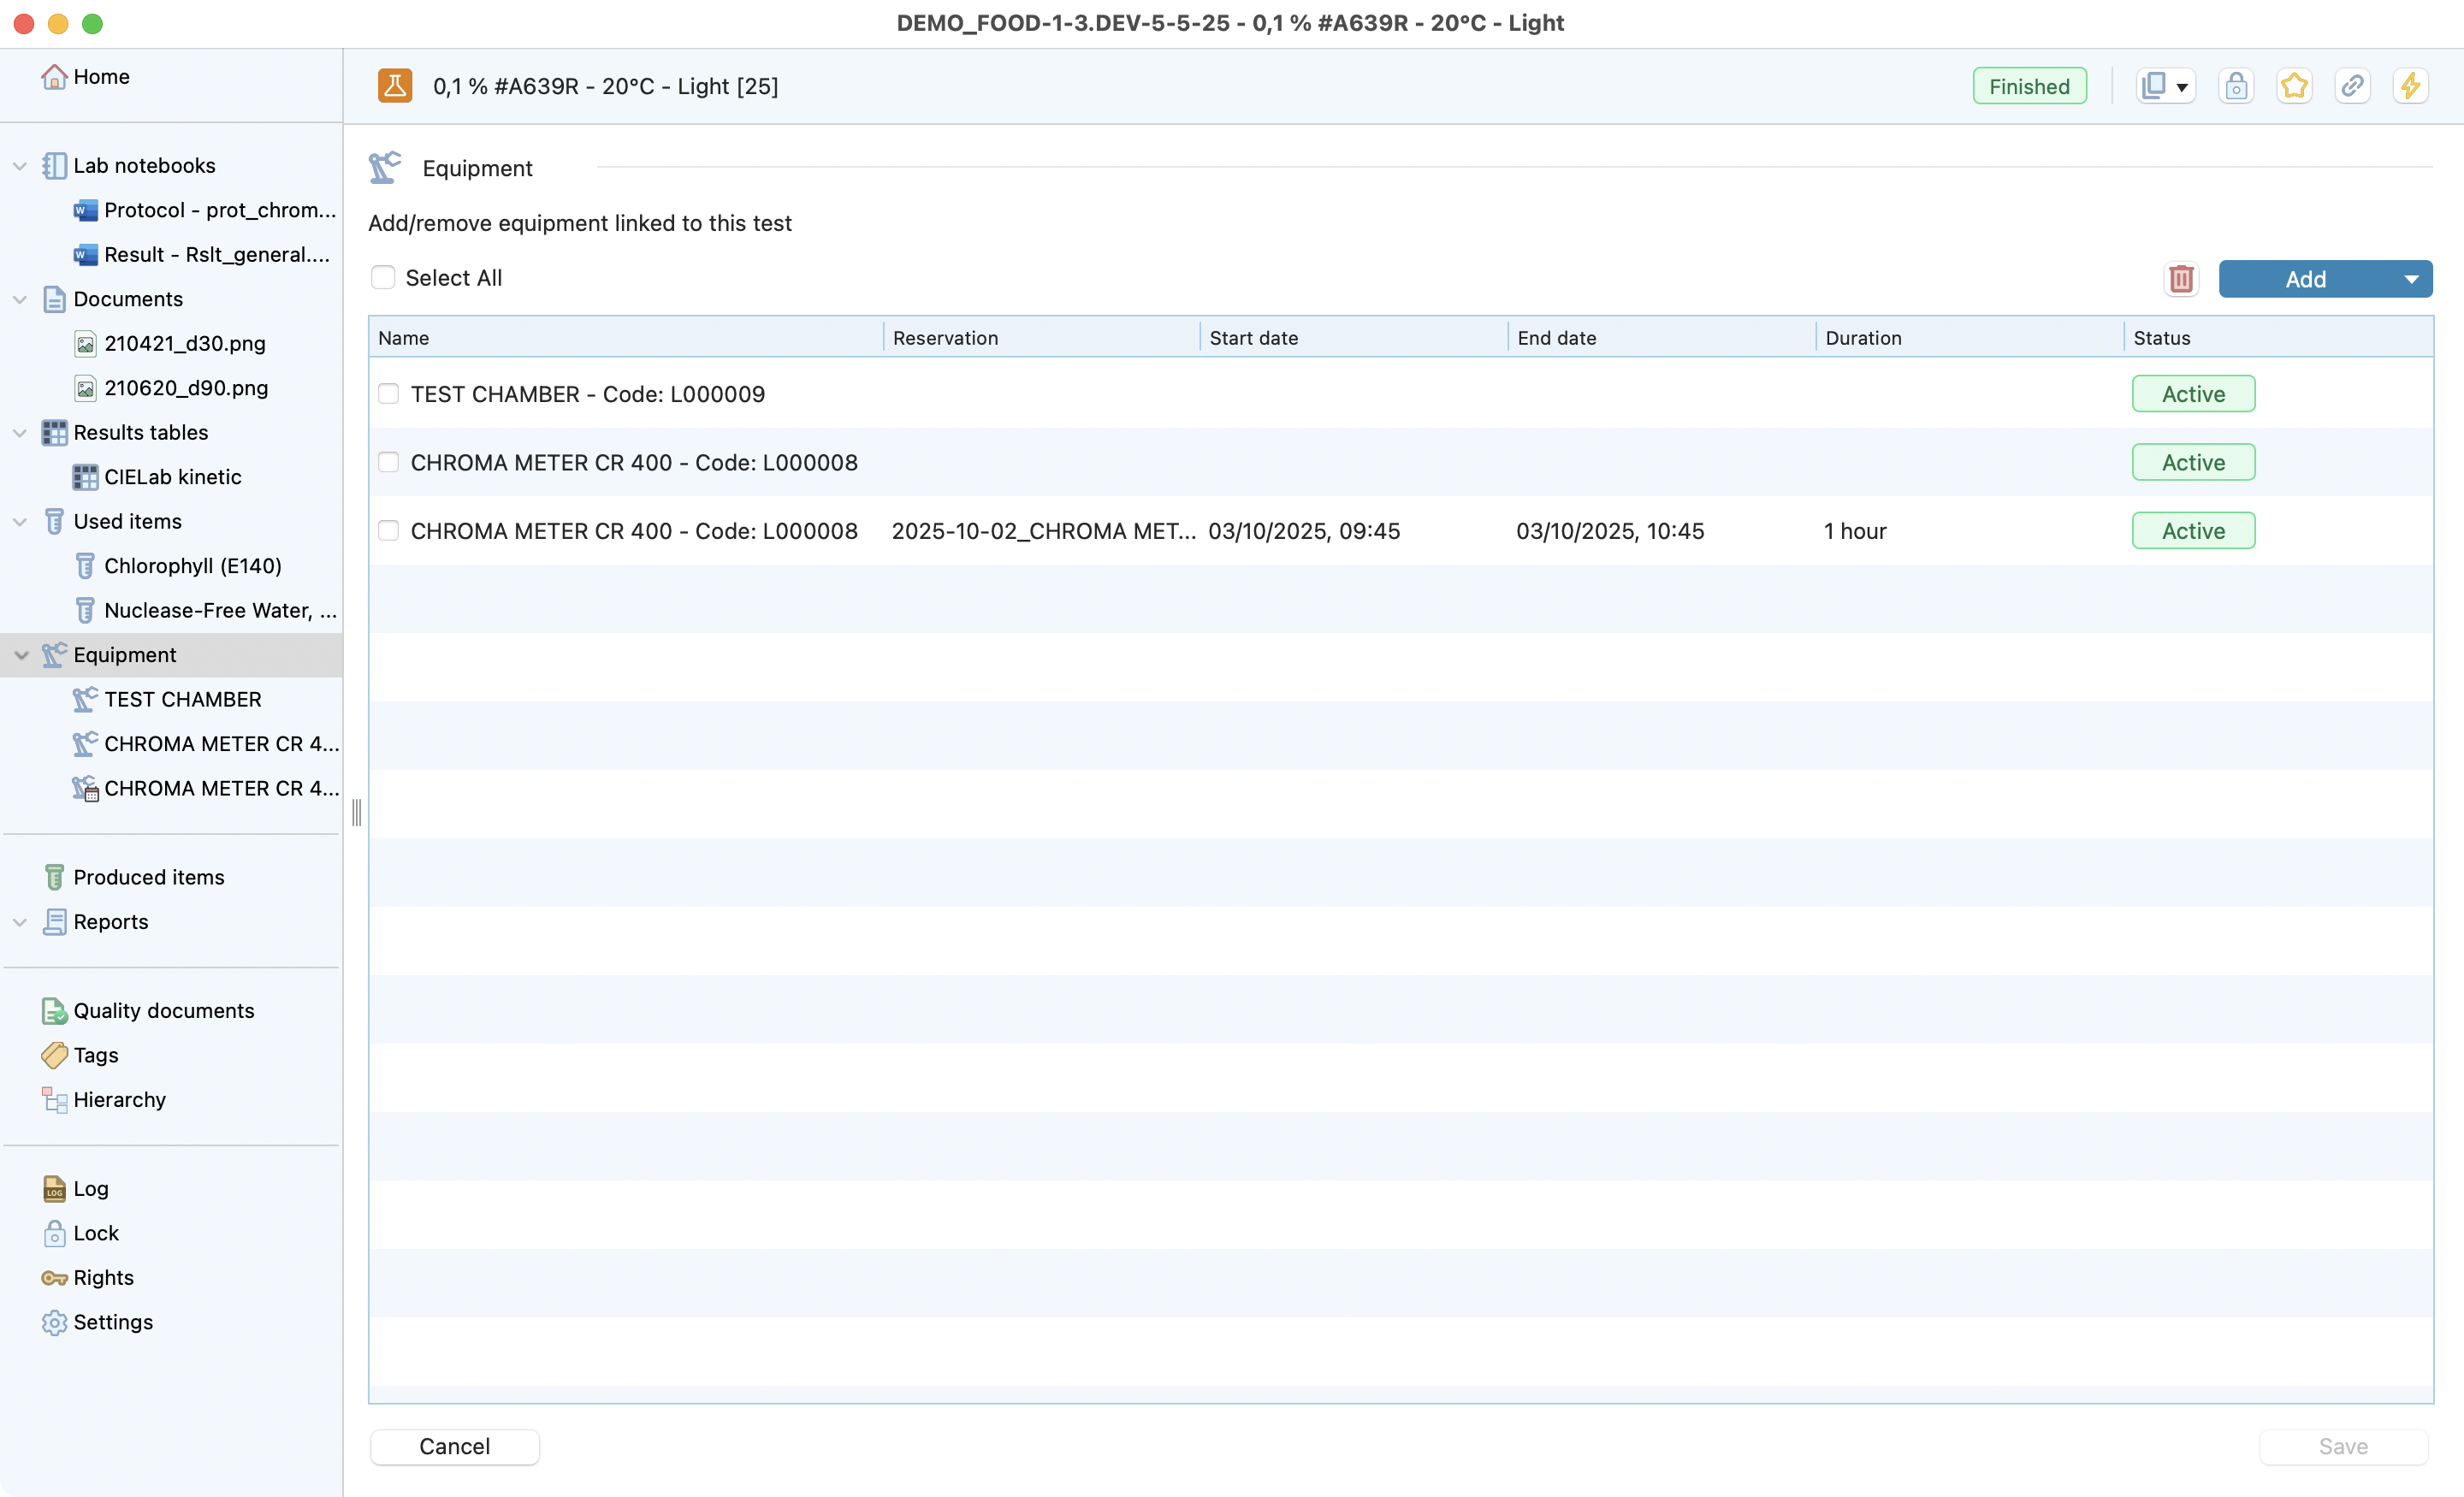
Newly added equipment is visible.
Click on the equipment name to see more details
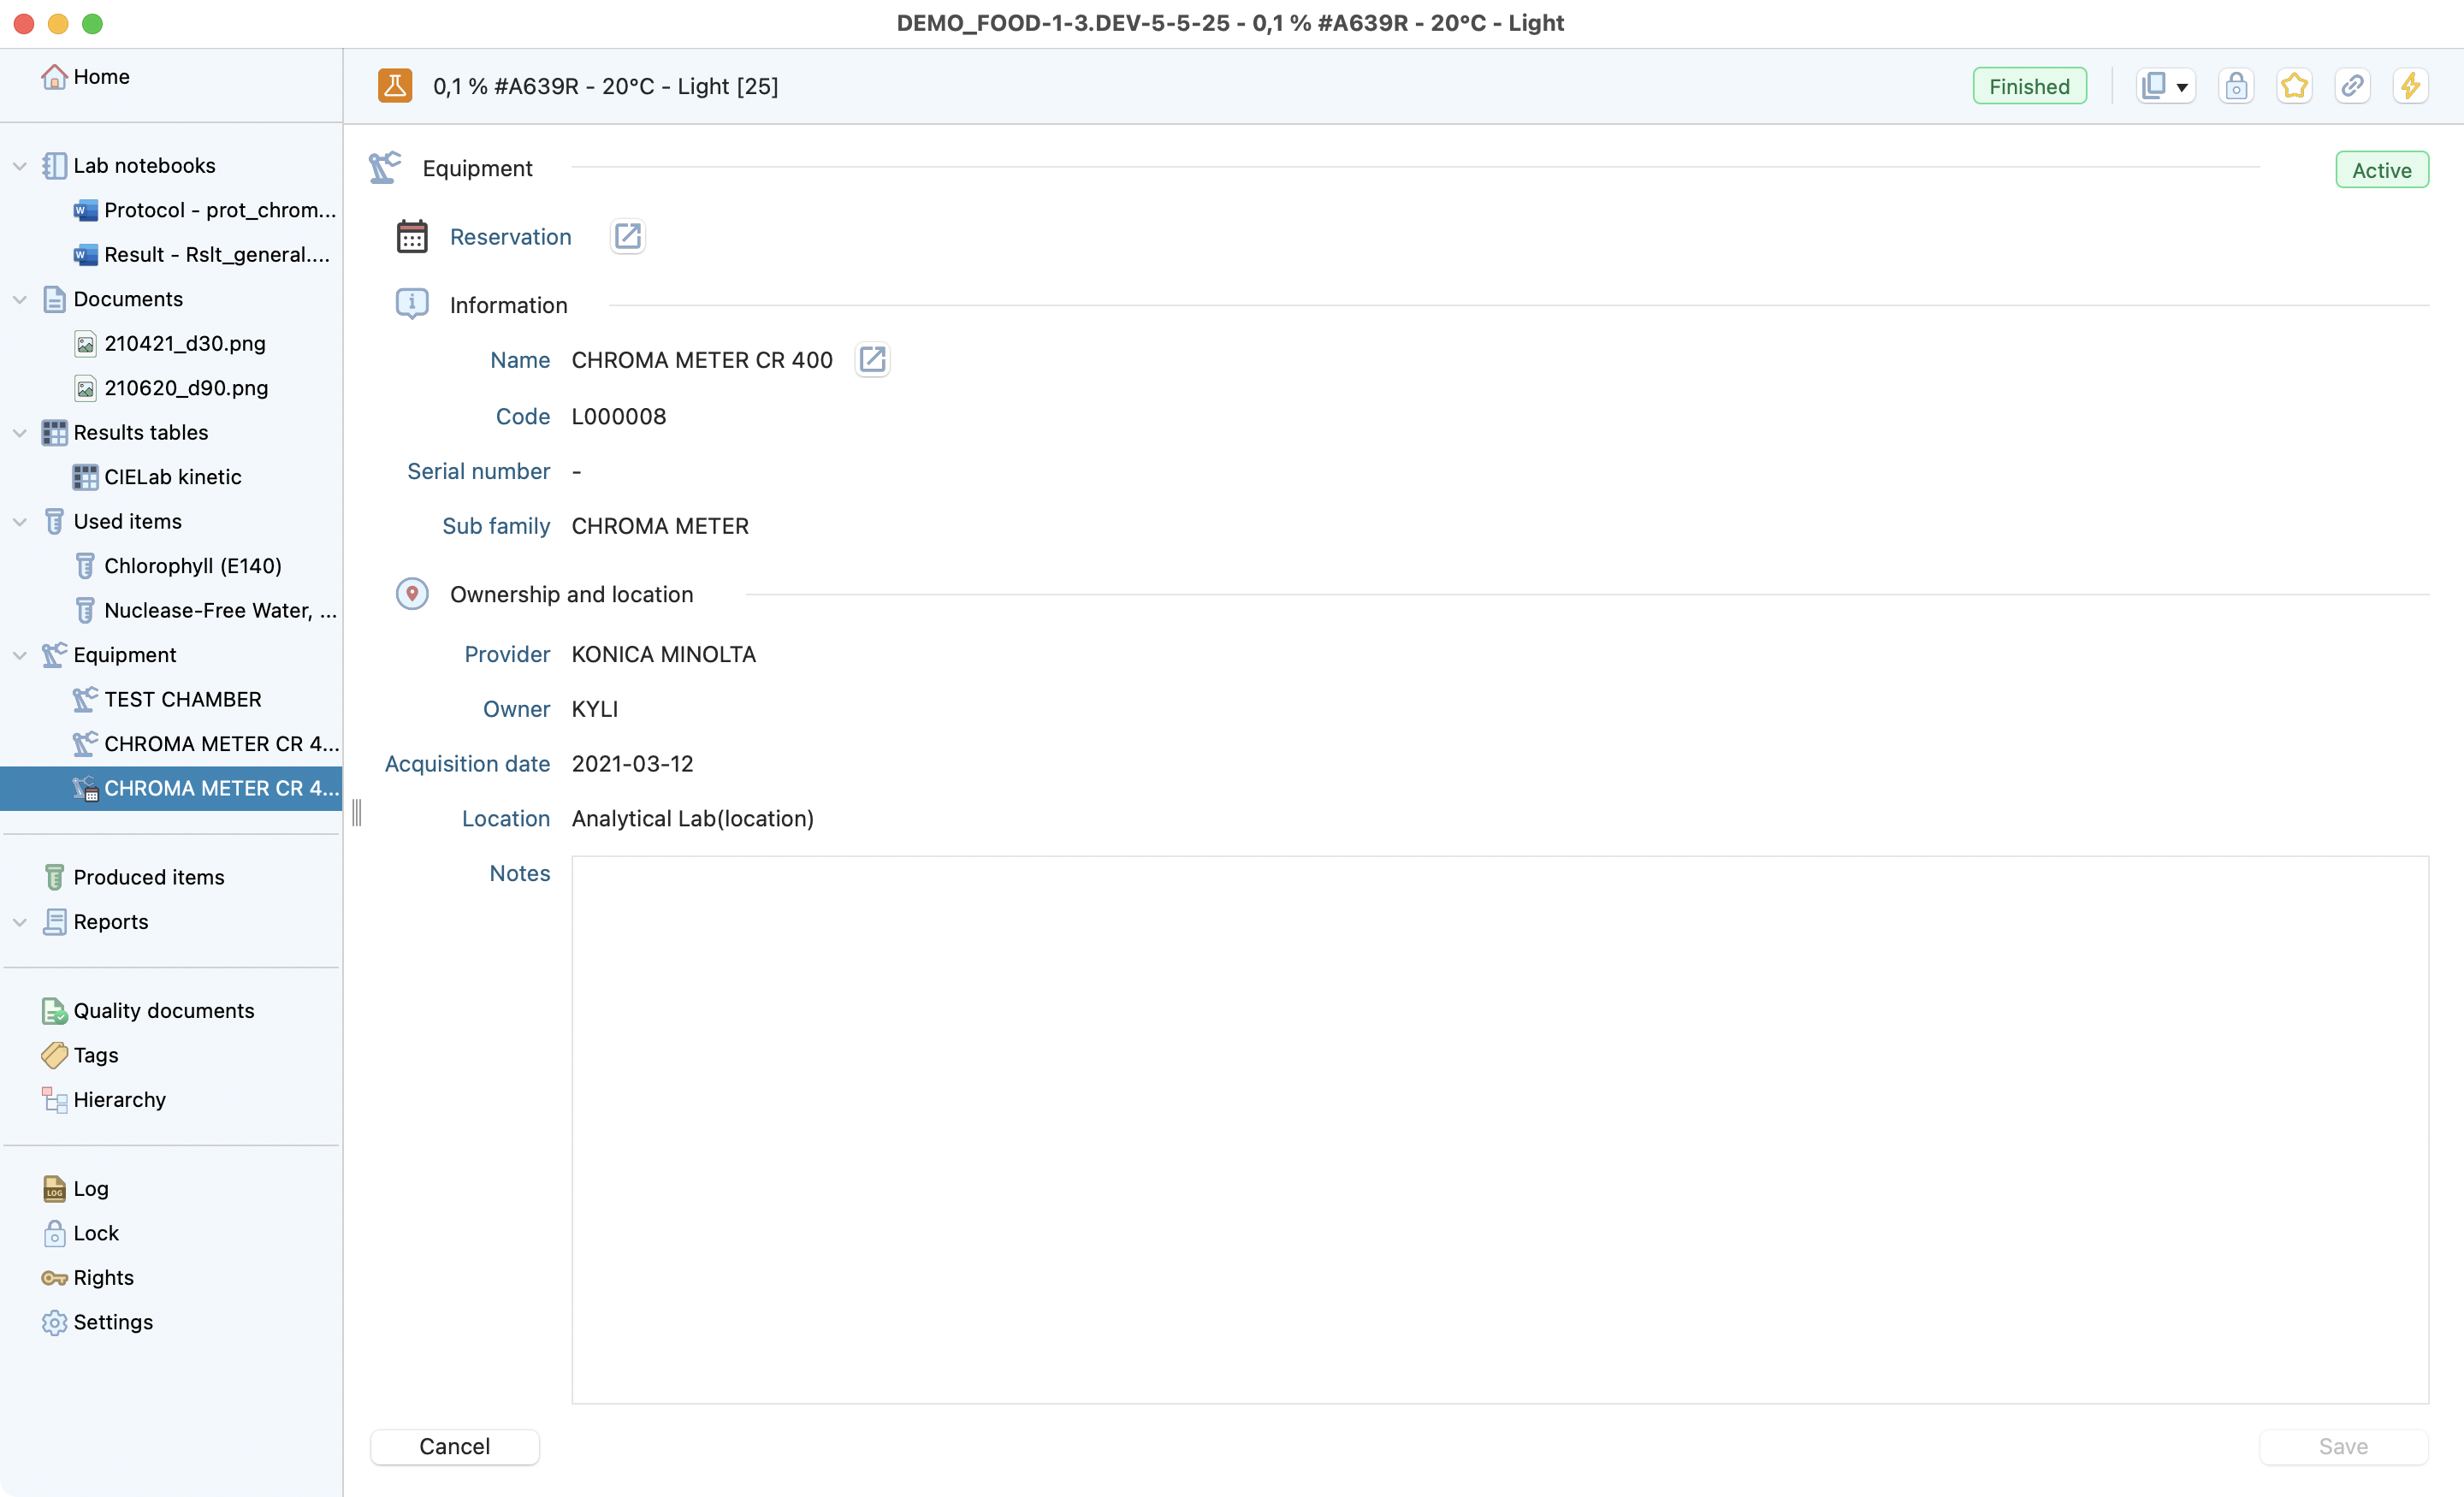
Details of an equipment from the test view.
Tip
It’s possible to directly go to the equipment details window by clicking on the button next to the equipment name.
Quality Documents
This “read only” section aims to show all documents that quality management linked to this test type at its creation. Stay up-to-date with the most relevant information, depending on the latest validations.
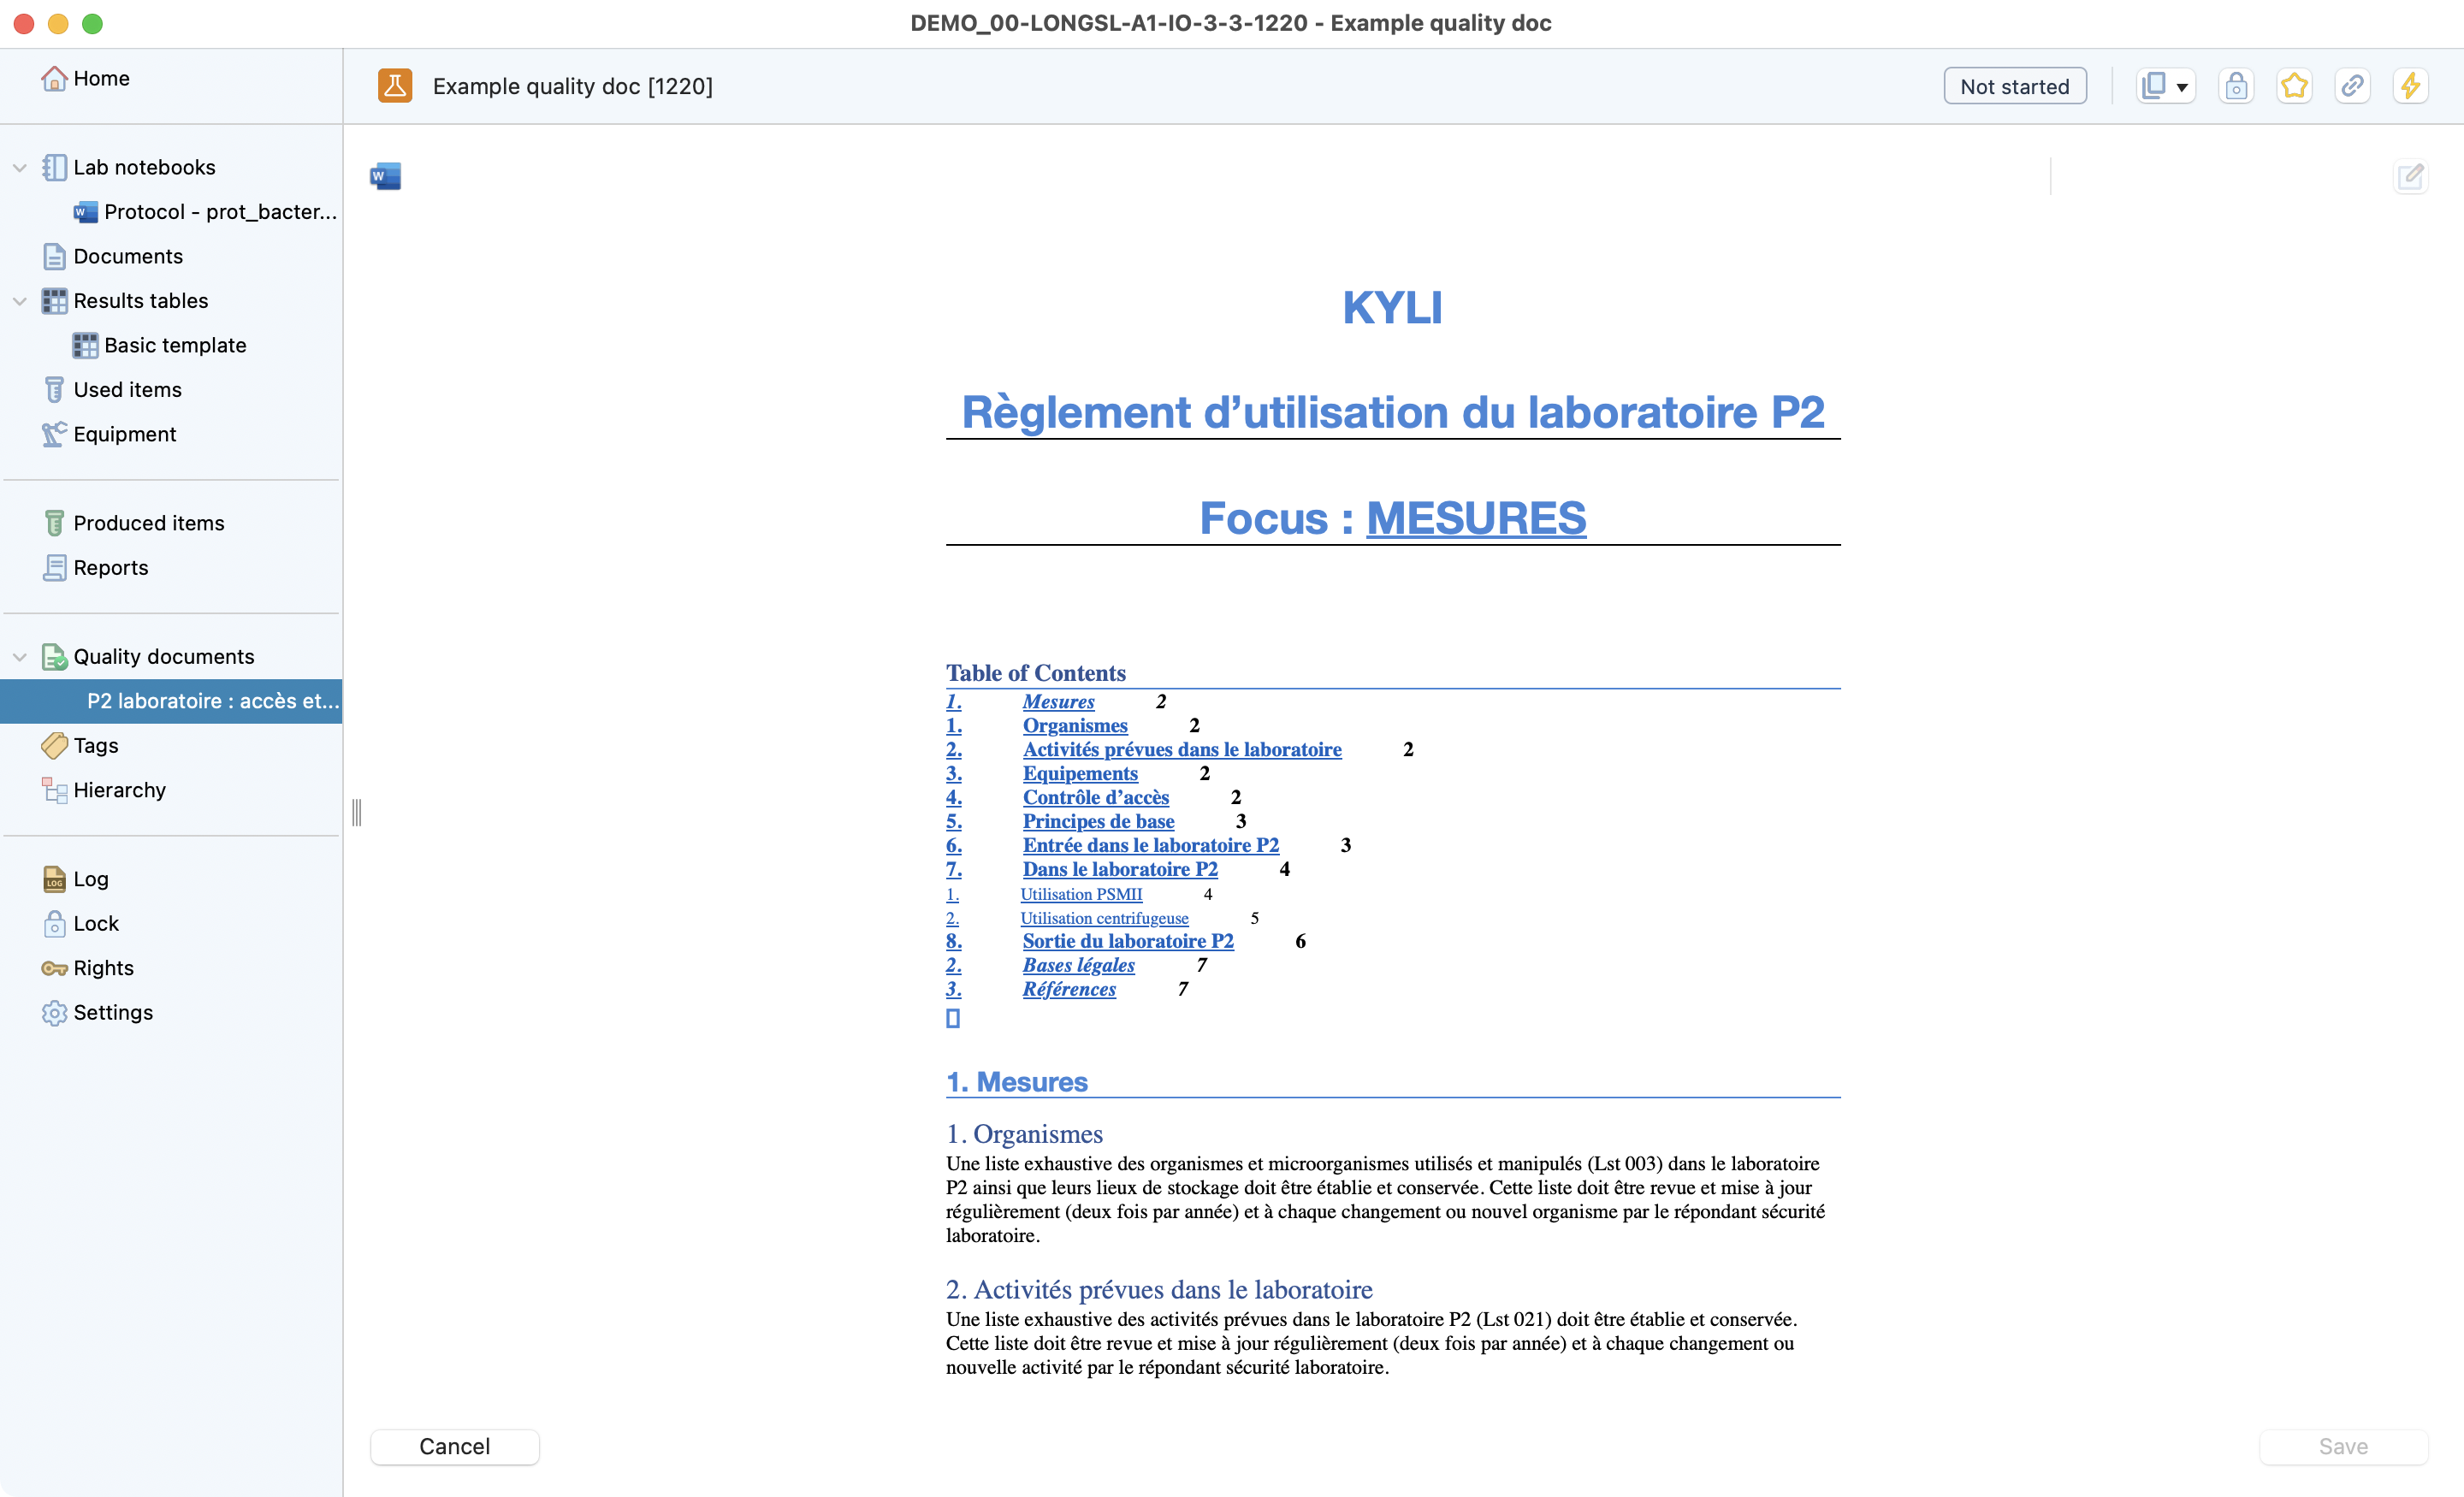
Quality documents view inside a test.
Report
Reports contain information like:
Project.
Responsible.
Dates.
Document names.
Items and equipments used.
Aggregate of your selected lab notebooks.
To generate a report to your test, you just need to click on the create button then define the reports name and select the lab notes you want to include.
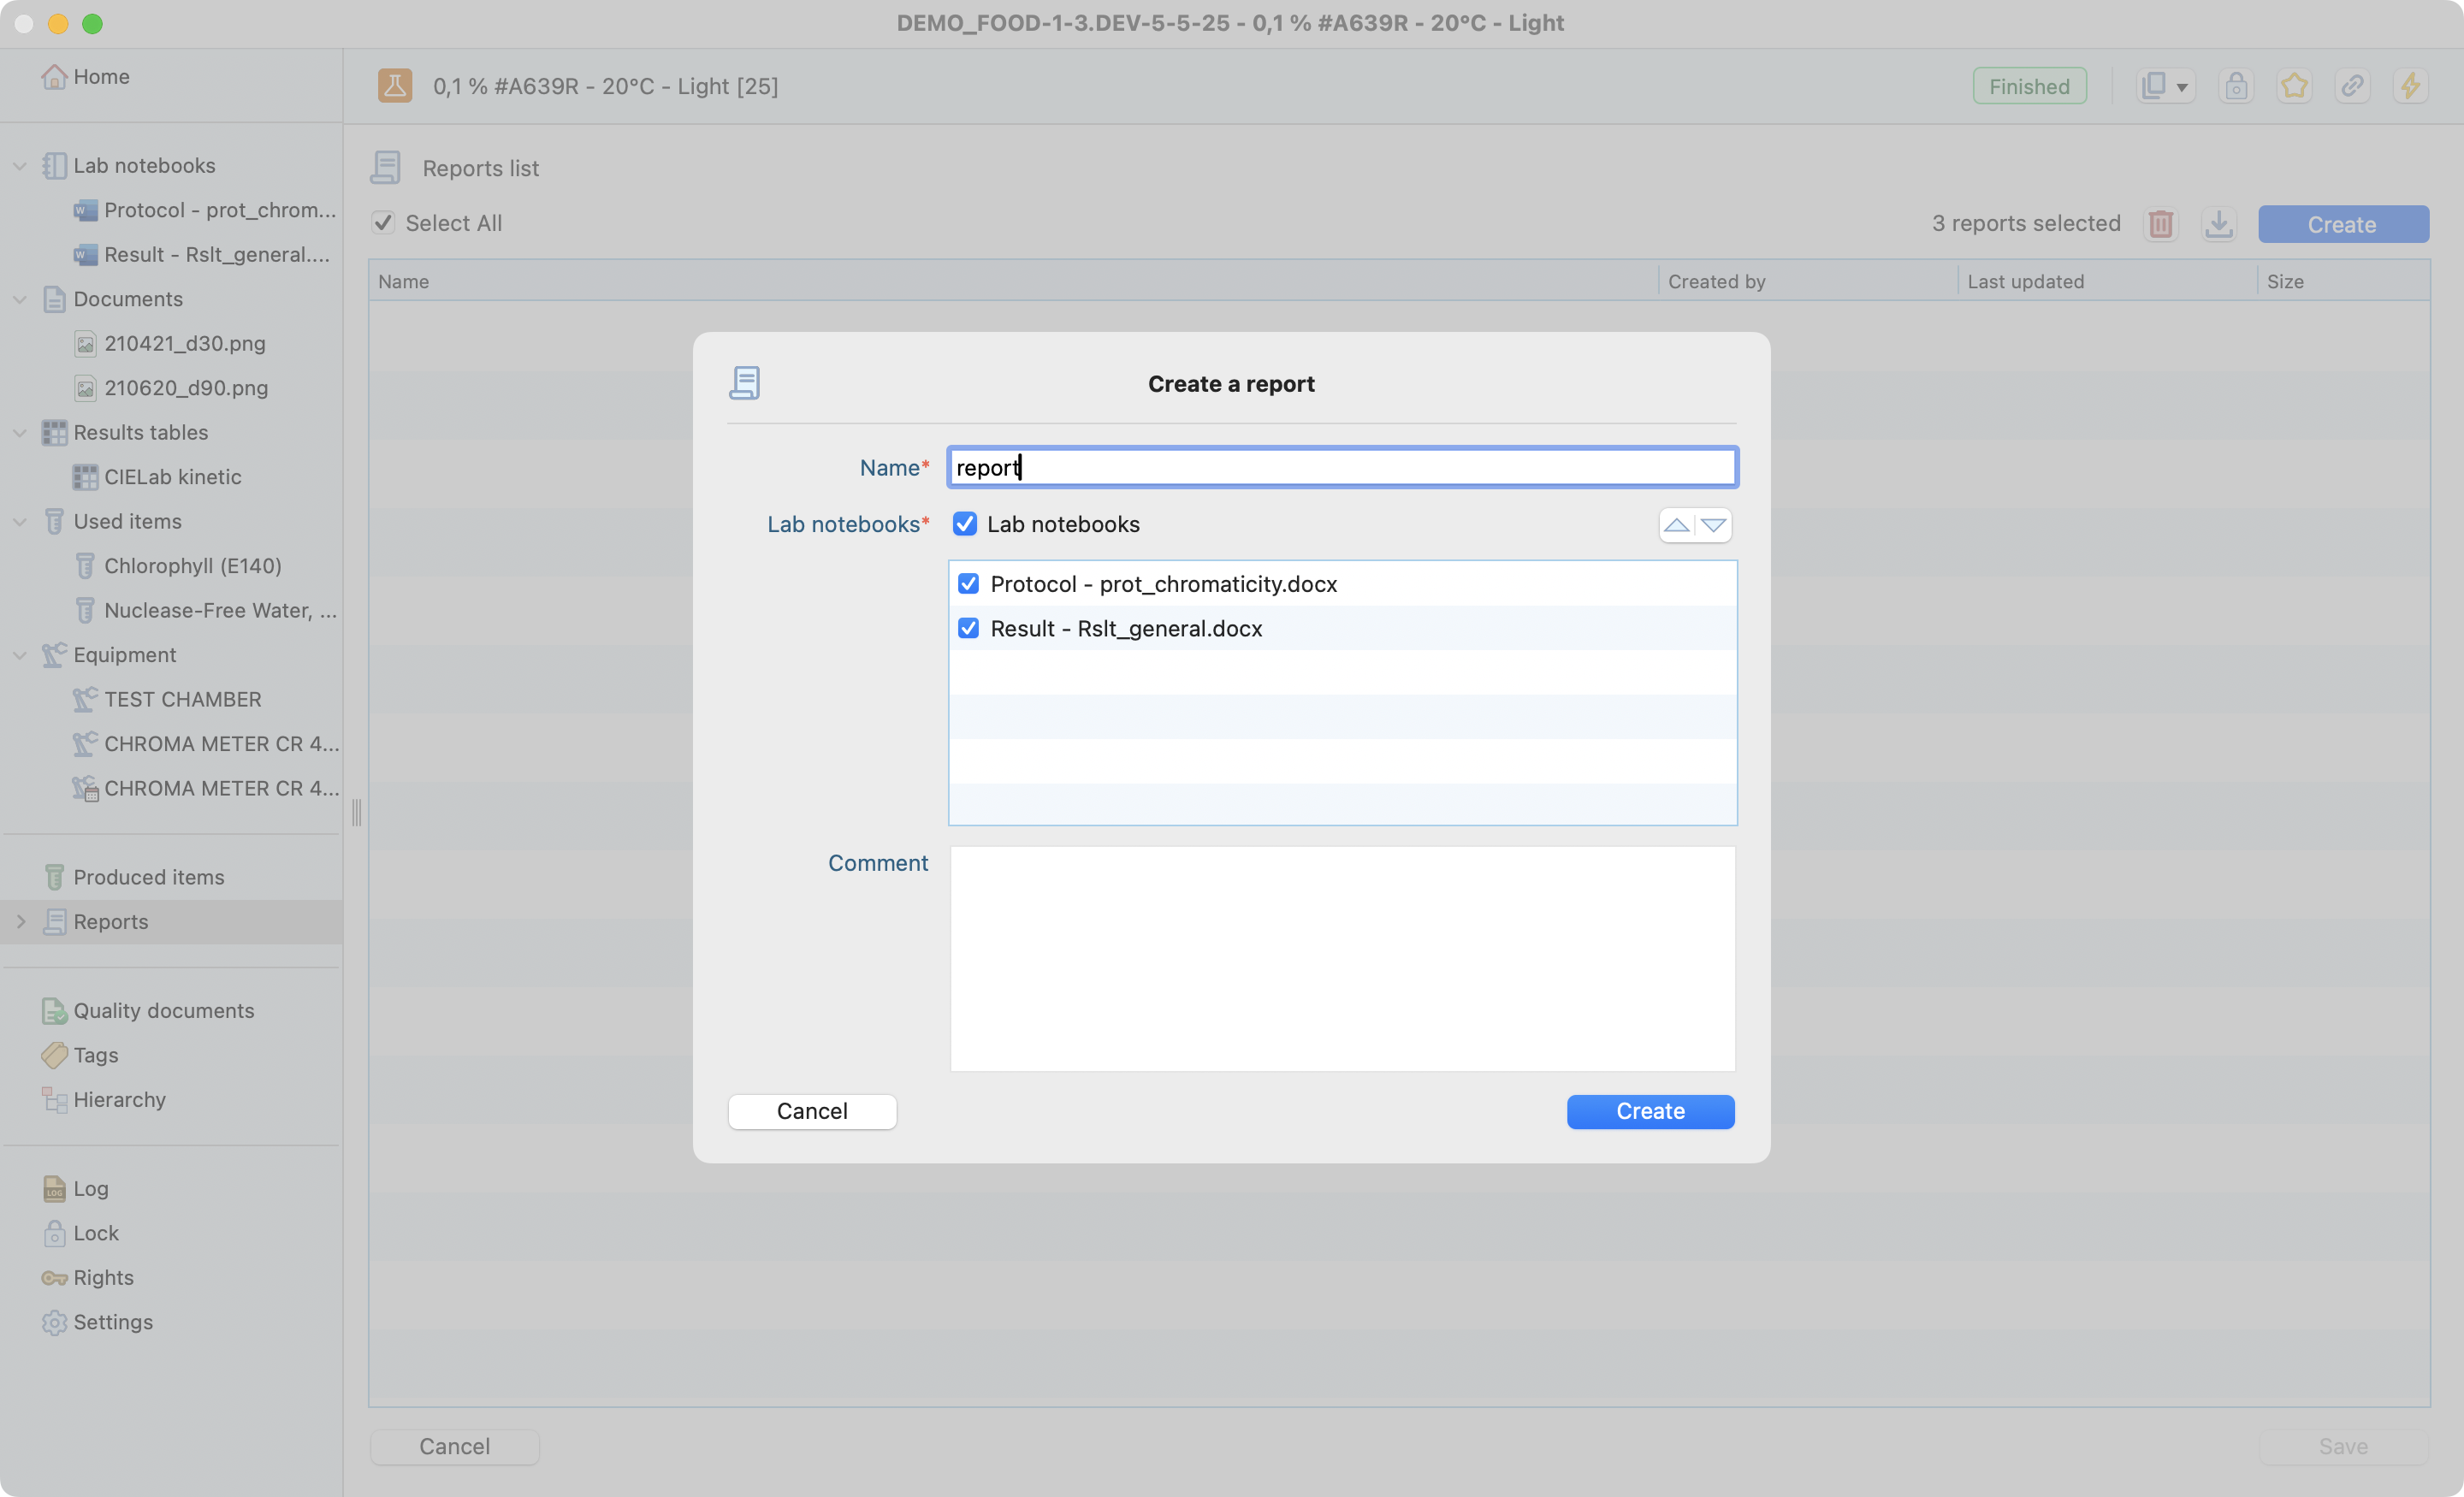
Report creation step.
Here is an example of a generated report:
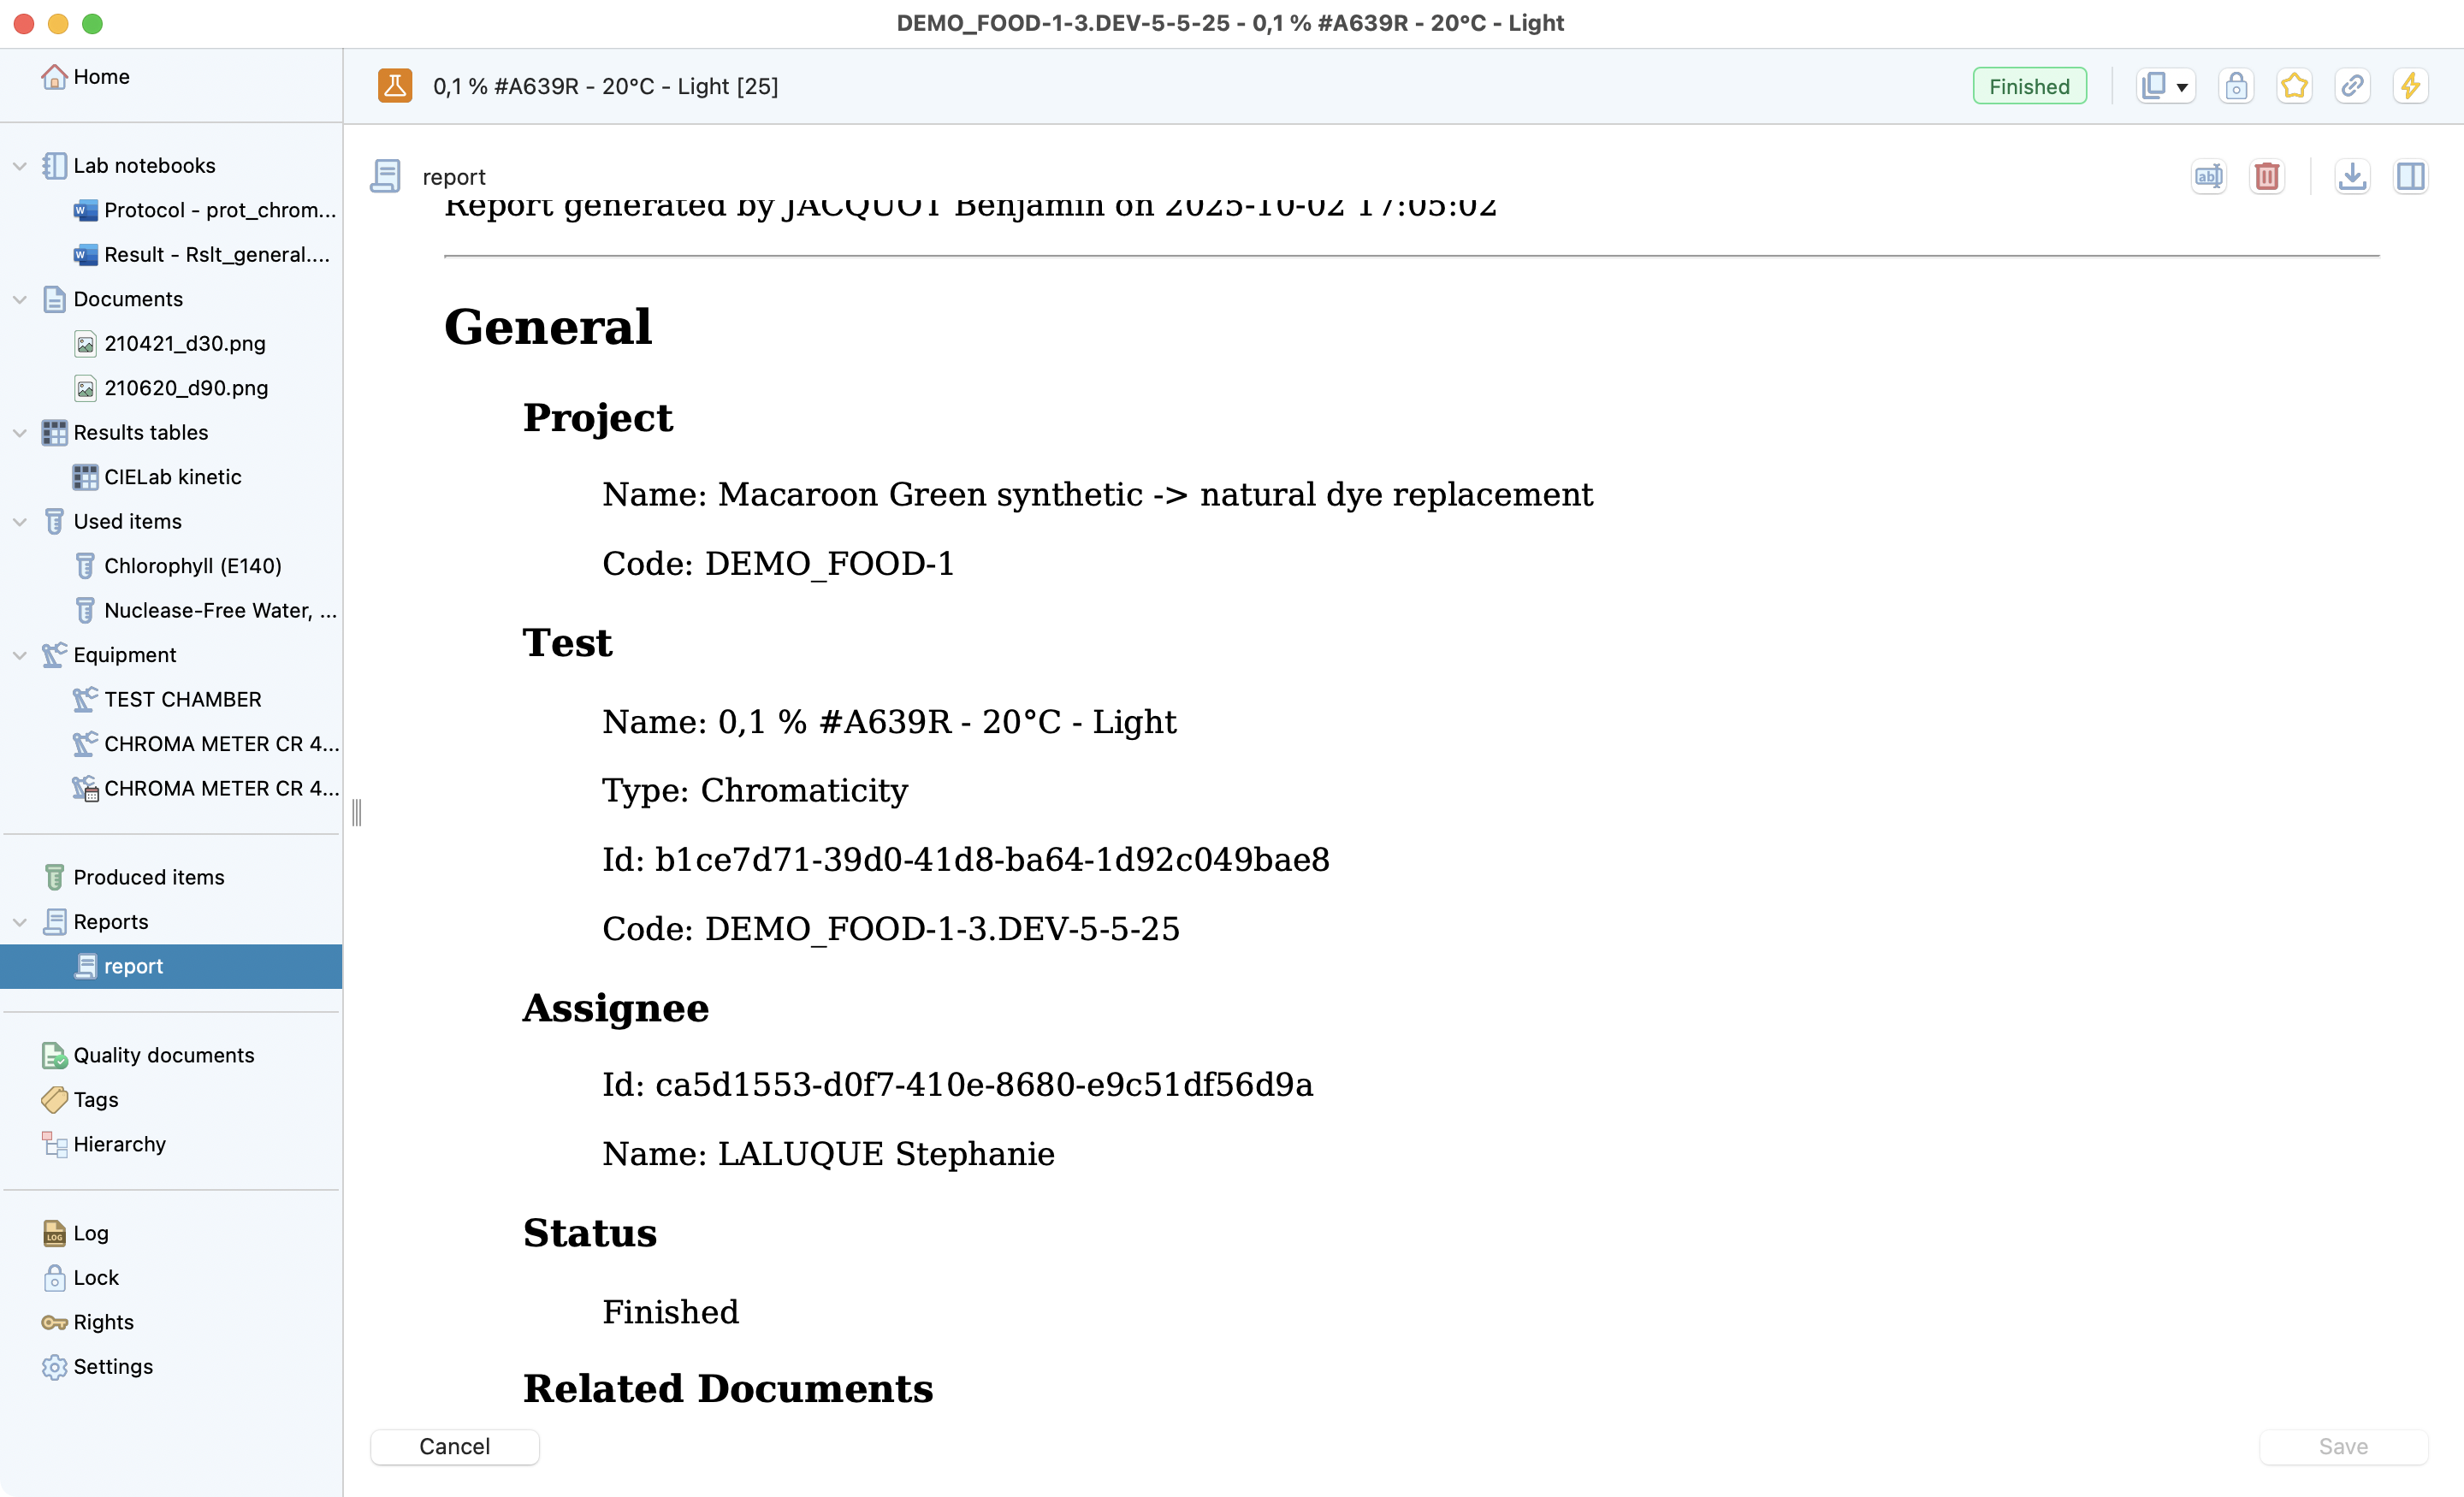
View of a generated report.
Tags
Adding tags can help you and your team find specific information from the global search. As you start writing, laby will automatically suggest existing tags to reinforce consistency. New tags will be automatically referenced and available to your colleagues.
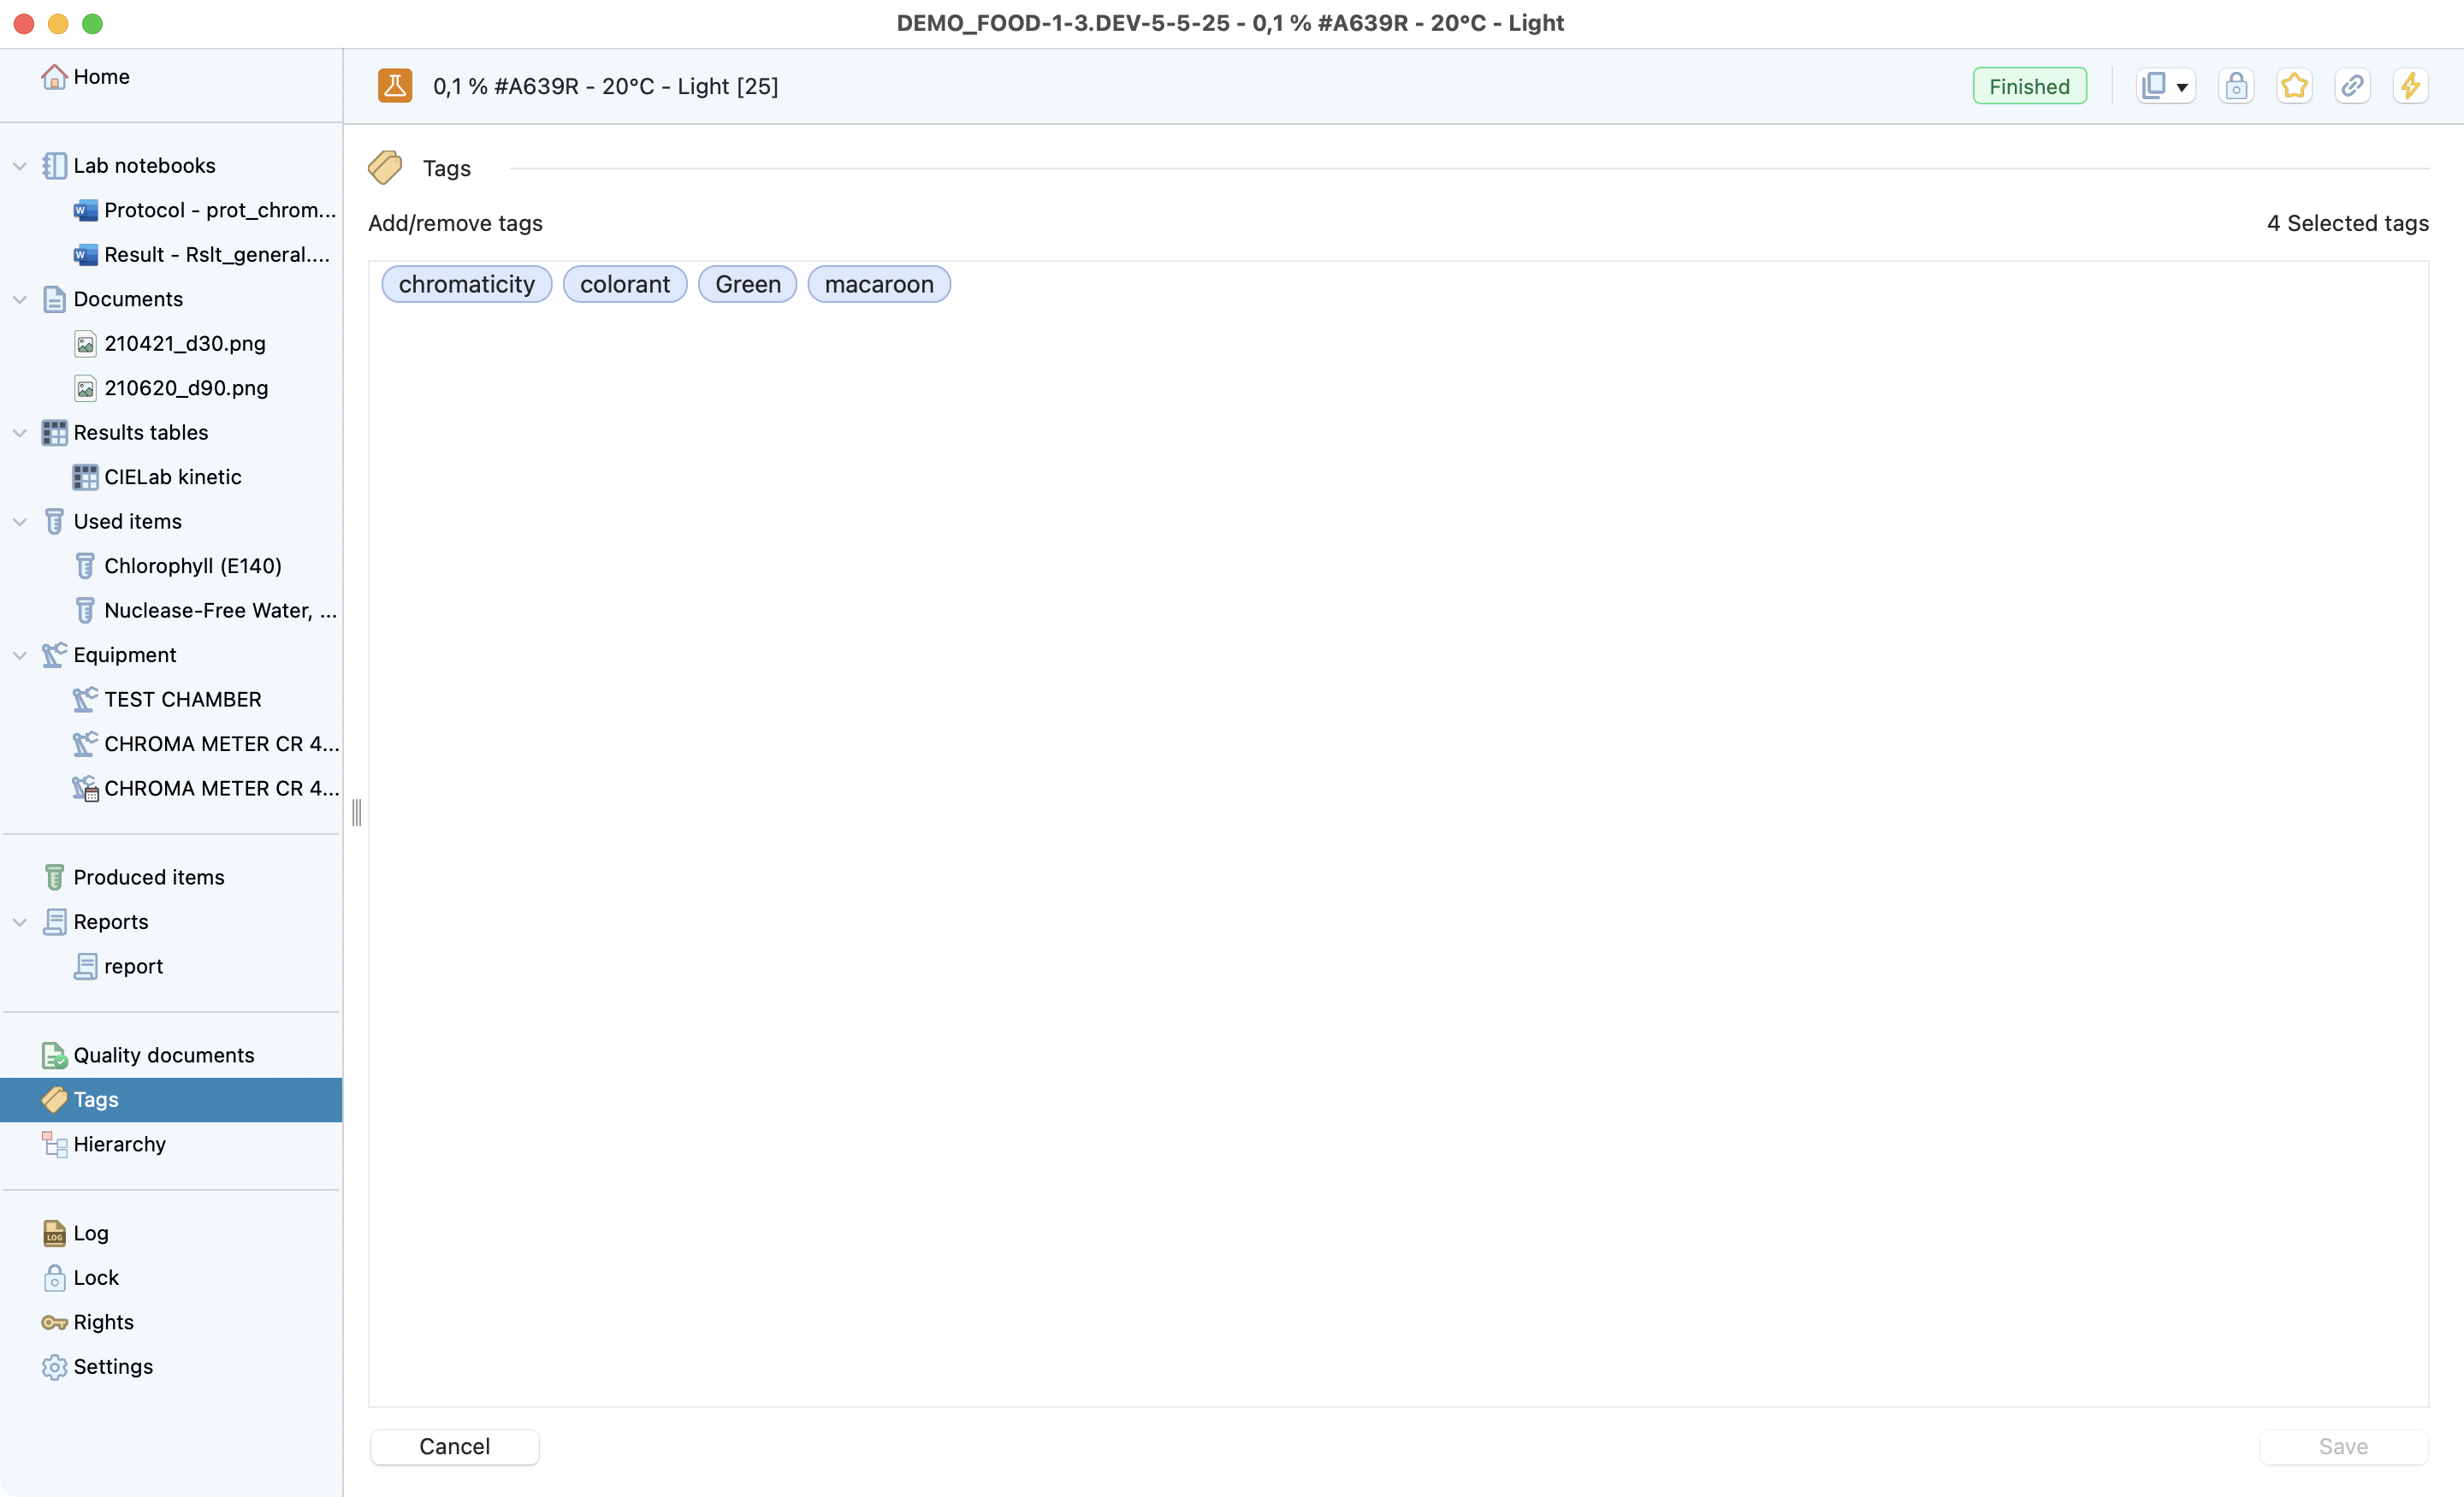
Tags view inside a test.
Lock
Lock: If you have finalized your test, Lock it to prevent any further modification. A header will then appear to inform your team that it can not be modified without unlocking it.
Dates start/end must be filled to lock a test.
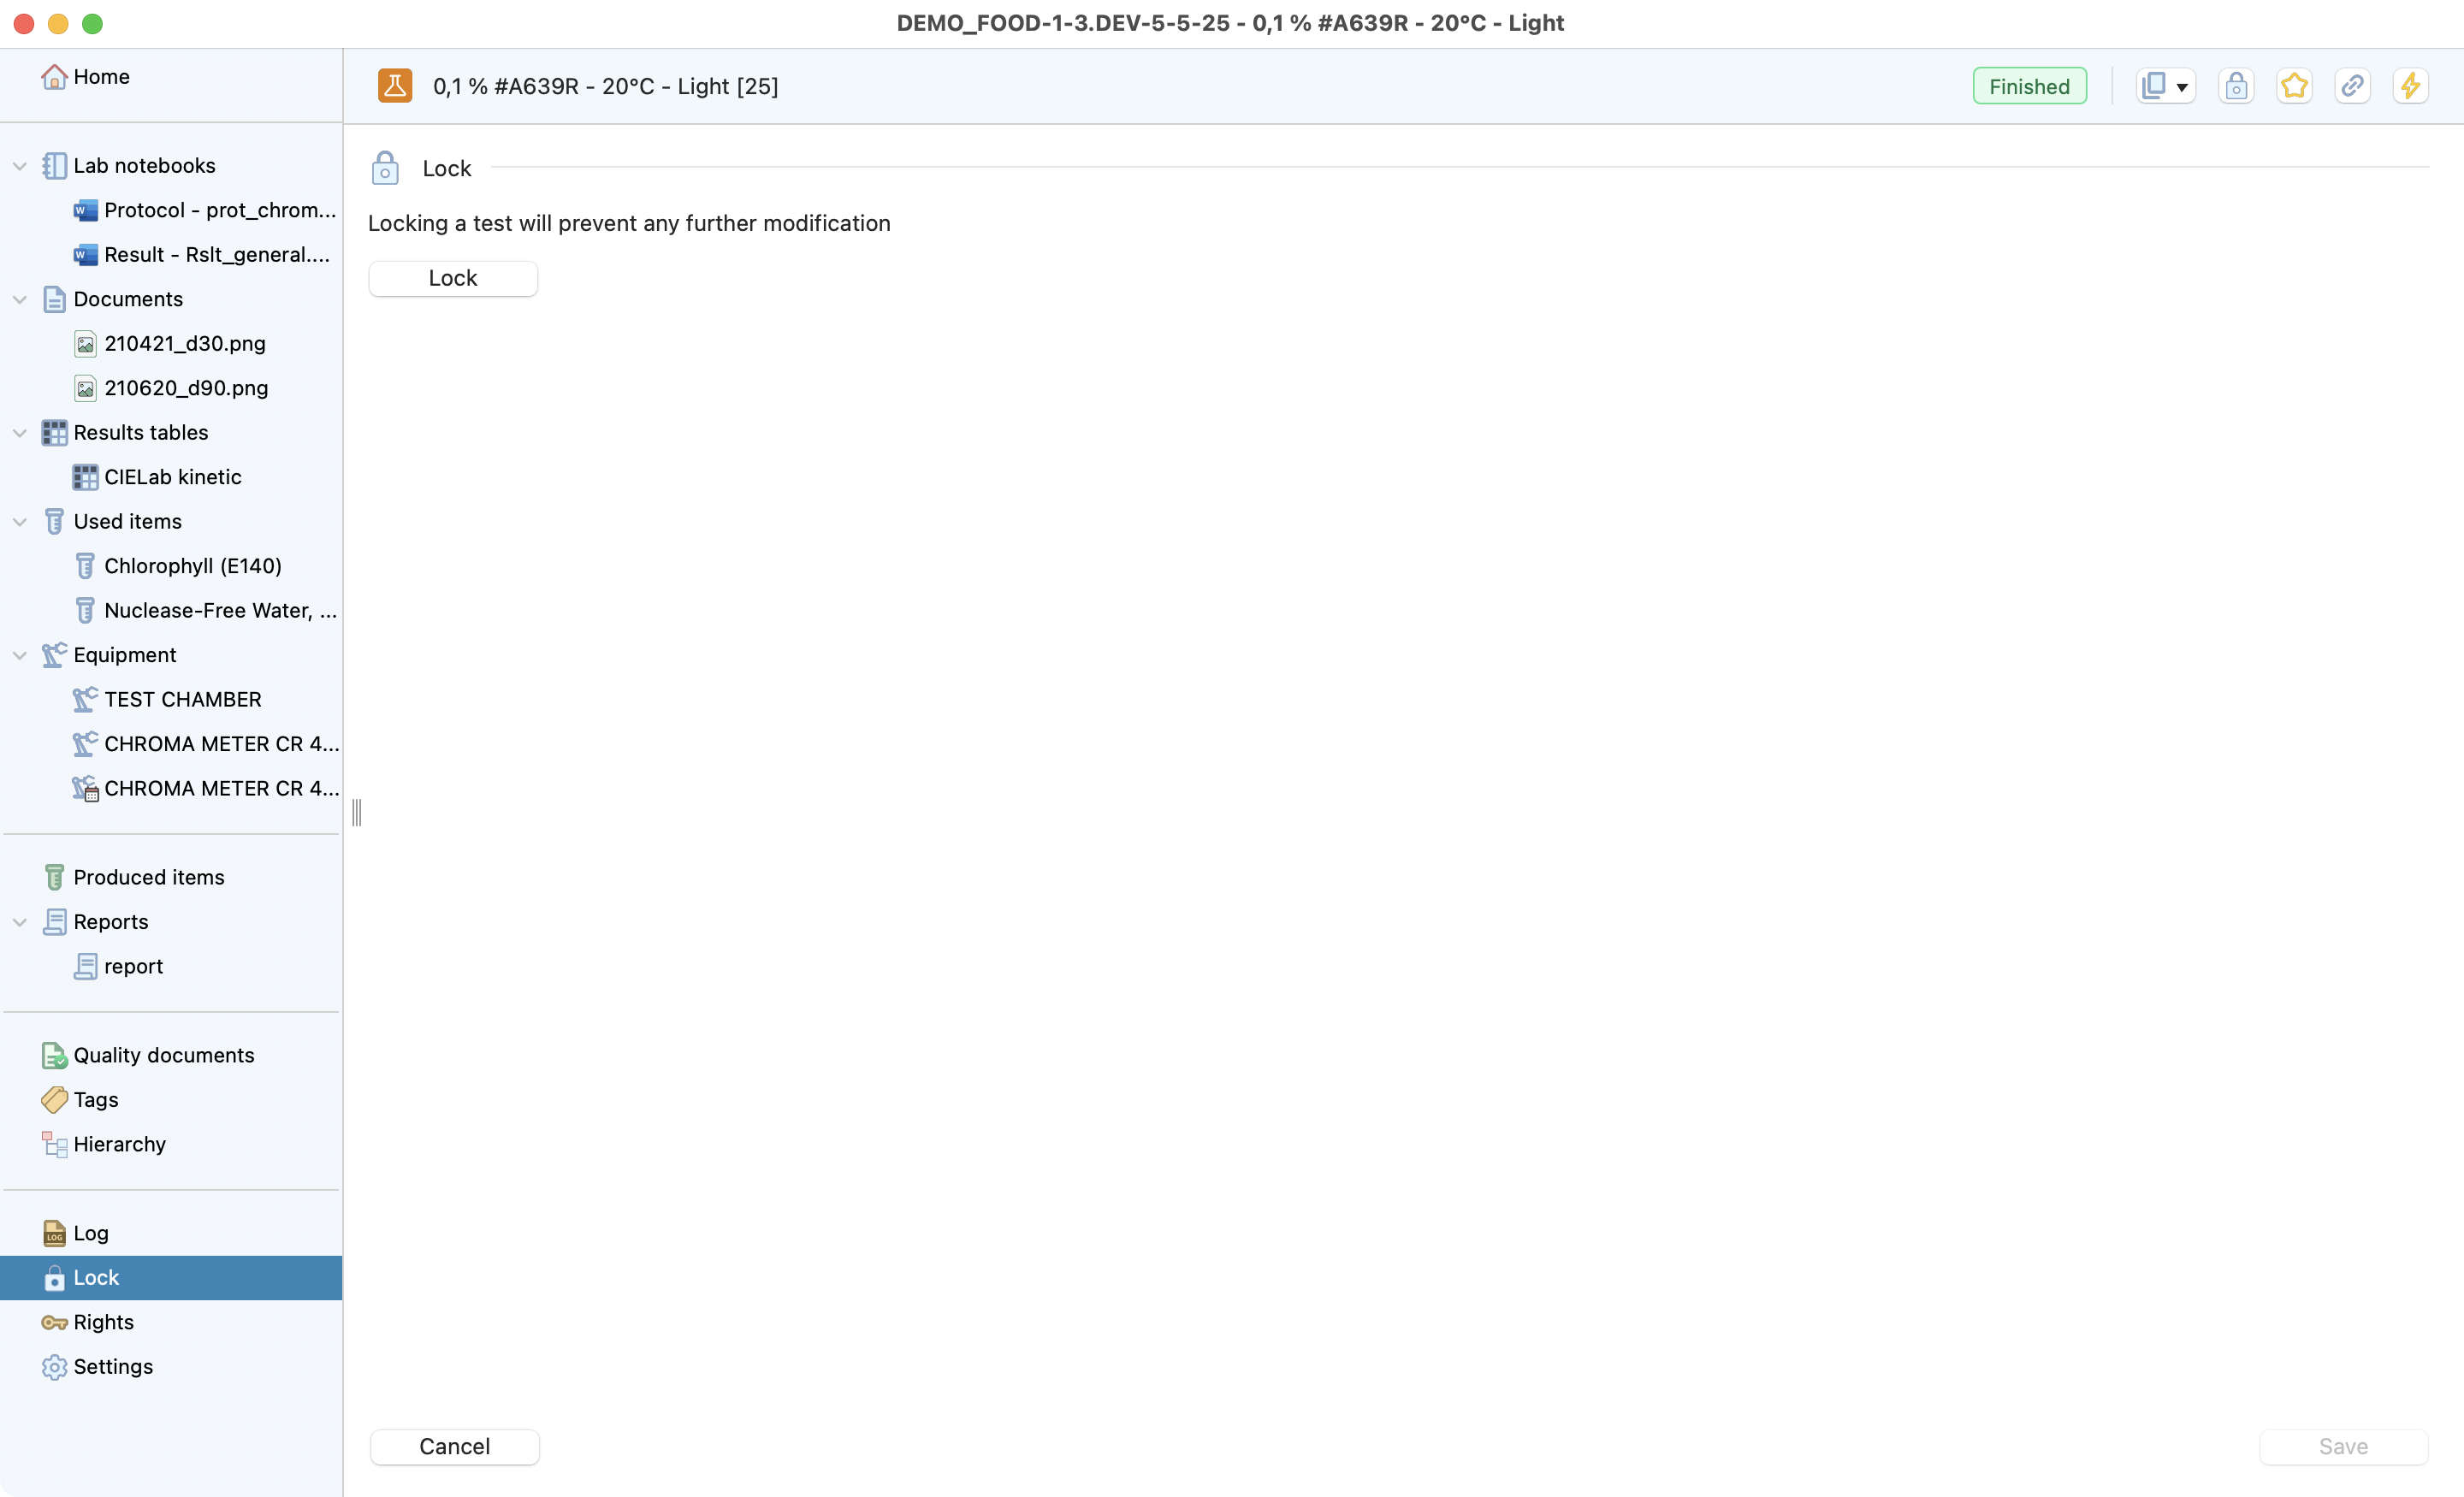
Lock view inside a test.
Note
You can lock the test directly from the main test menu by clicking on the lock icon.
Hierarchy
With one click you can get the full context of a test, navigating directly to other entities. For that, you just select and entity and then click in the deploy in hierarchy button.
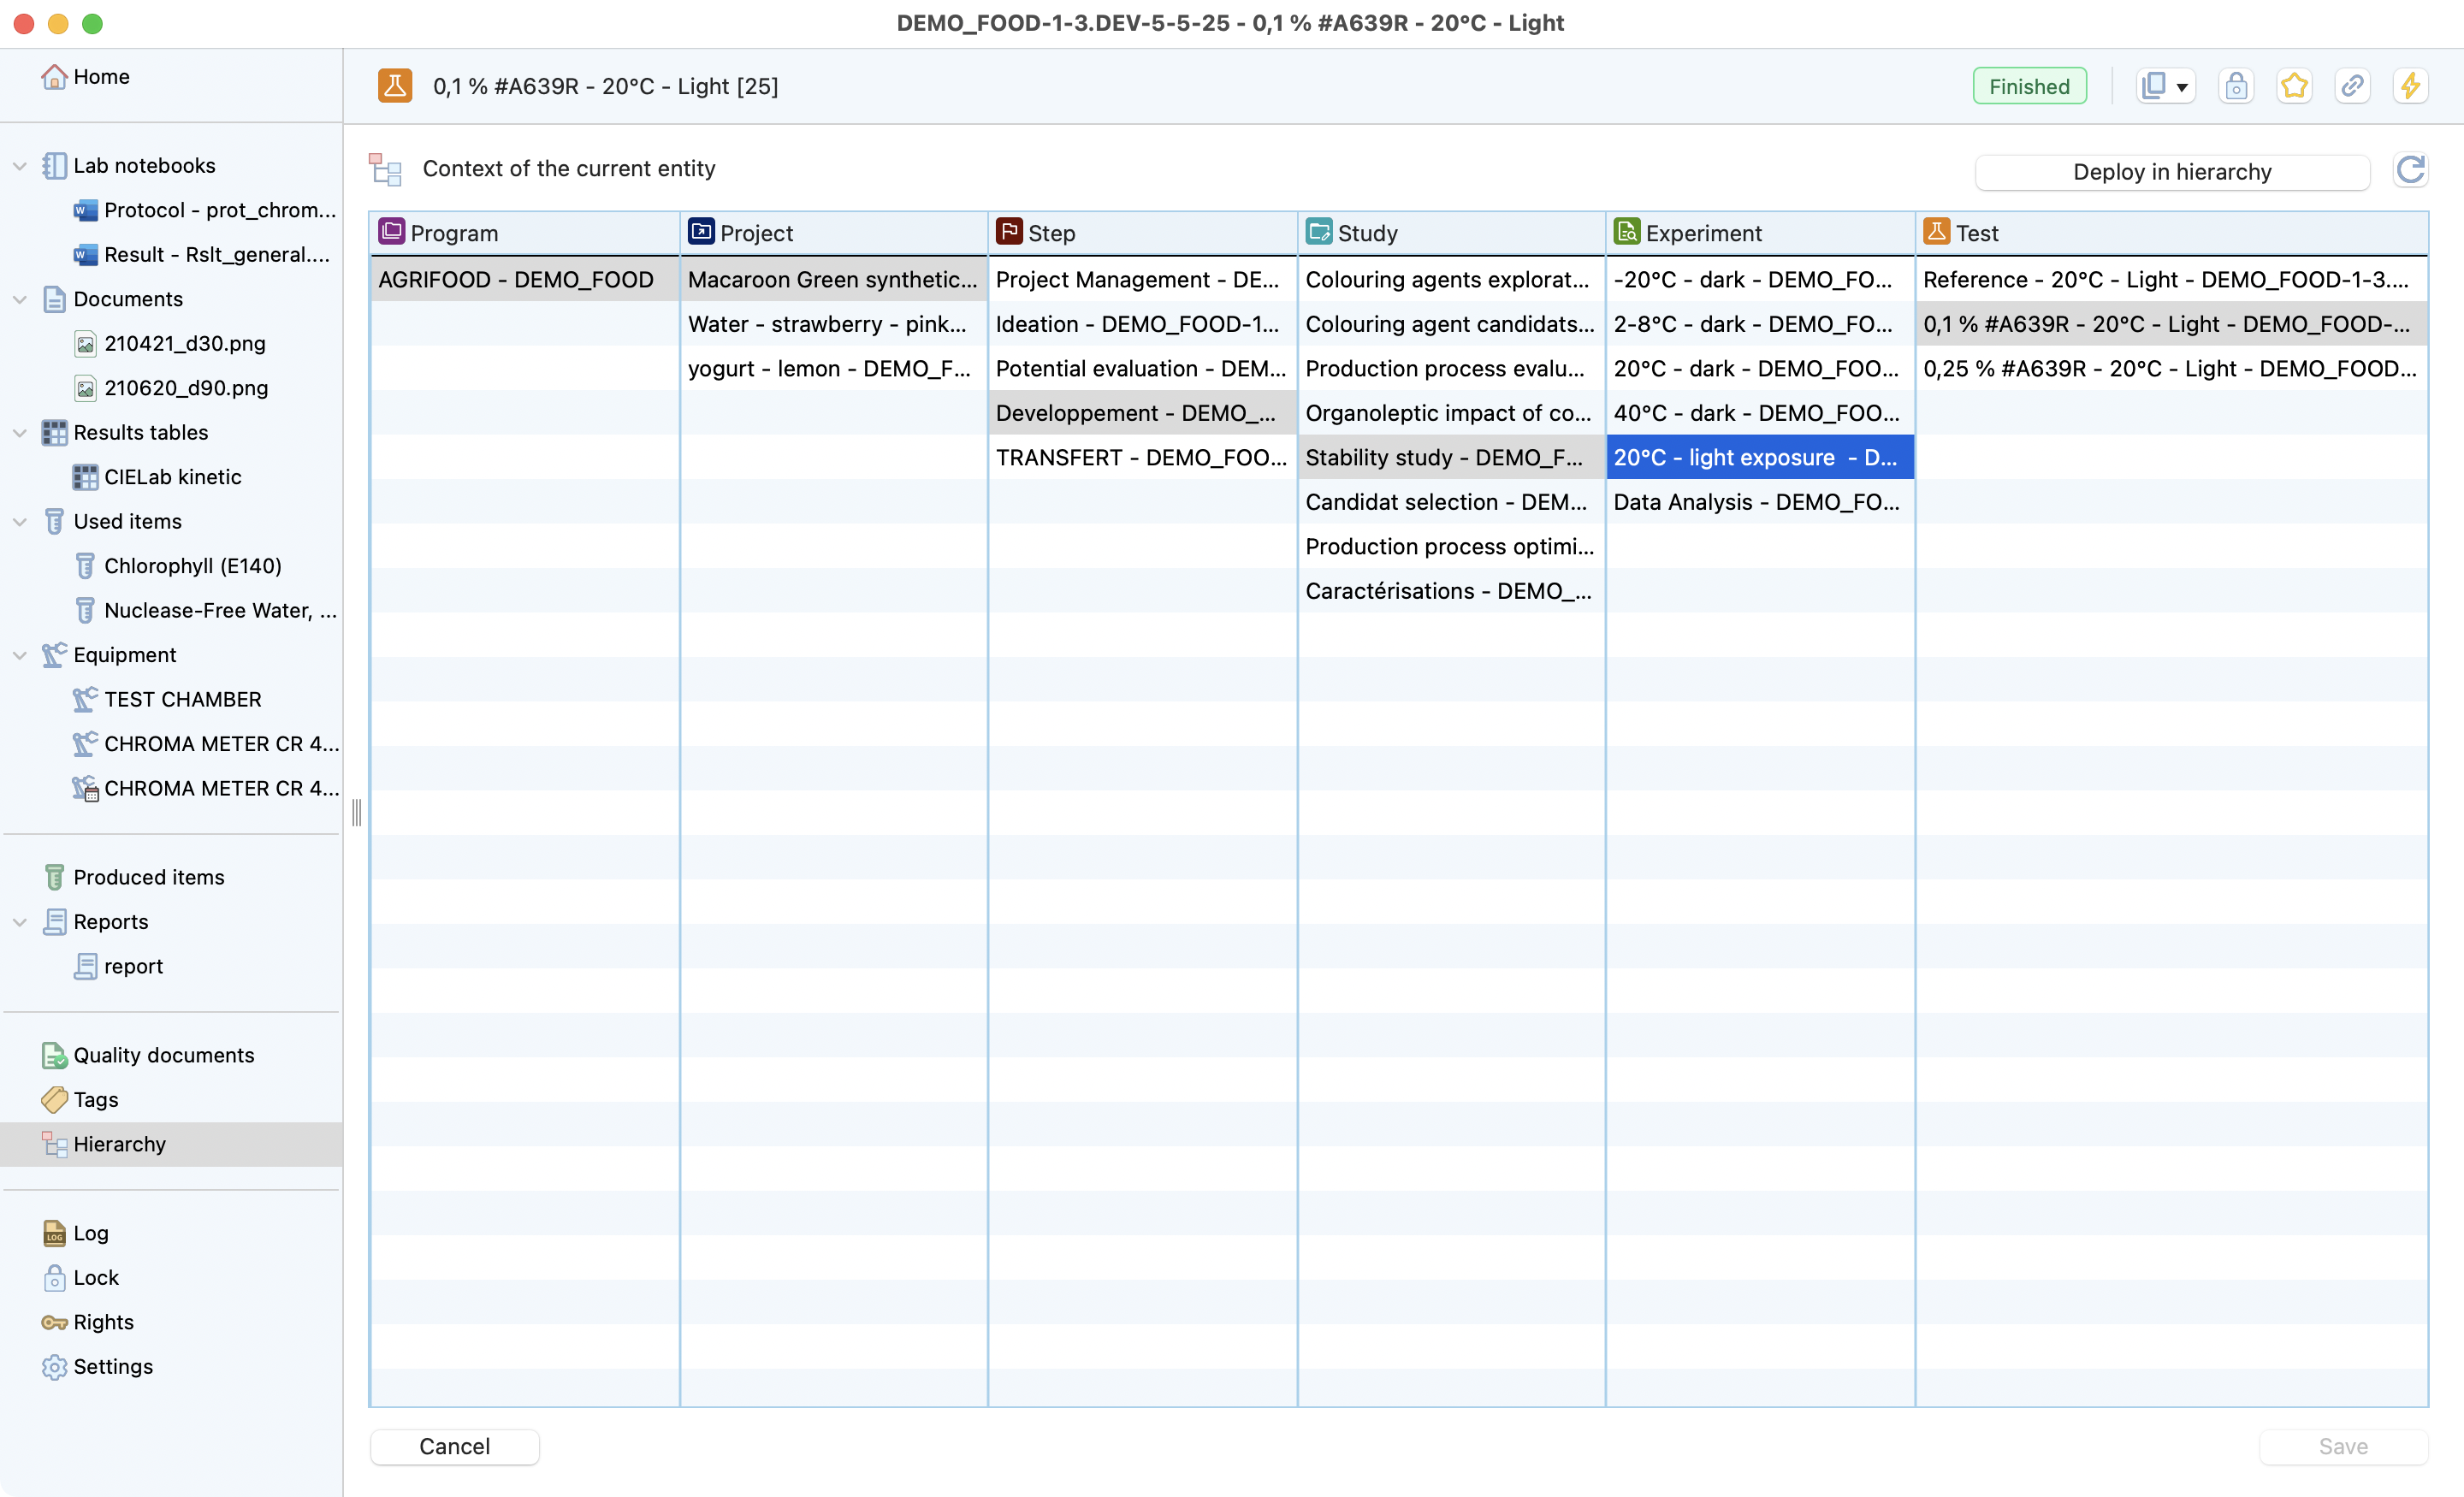
Hierarchy view inside a test.
Rights
In this section, you can check the rights that were addressed to each user.
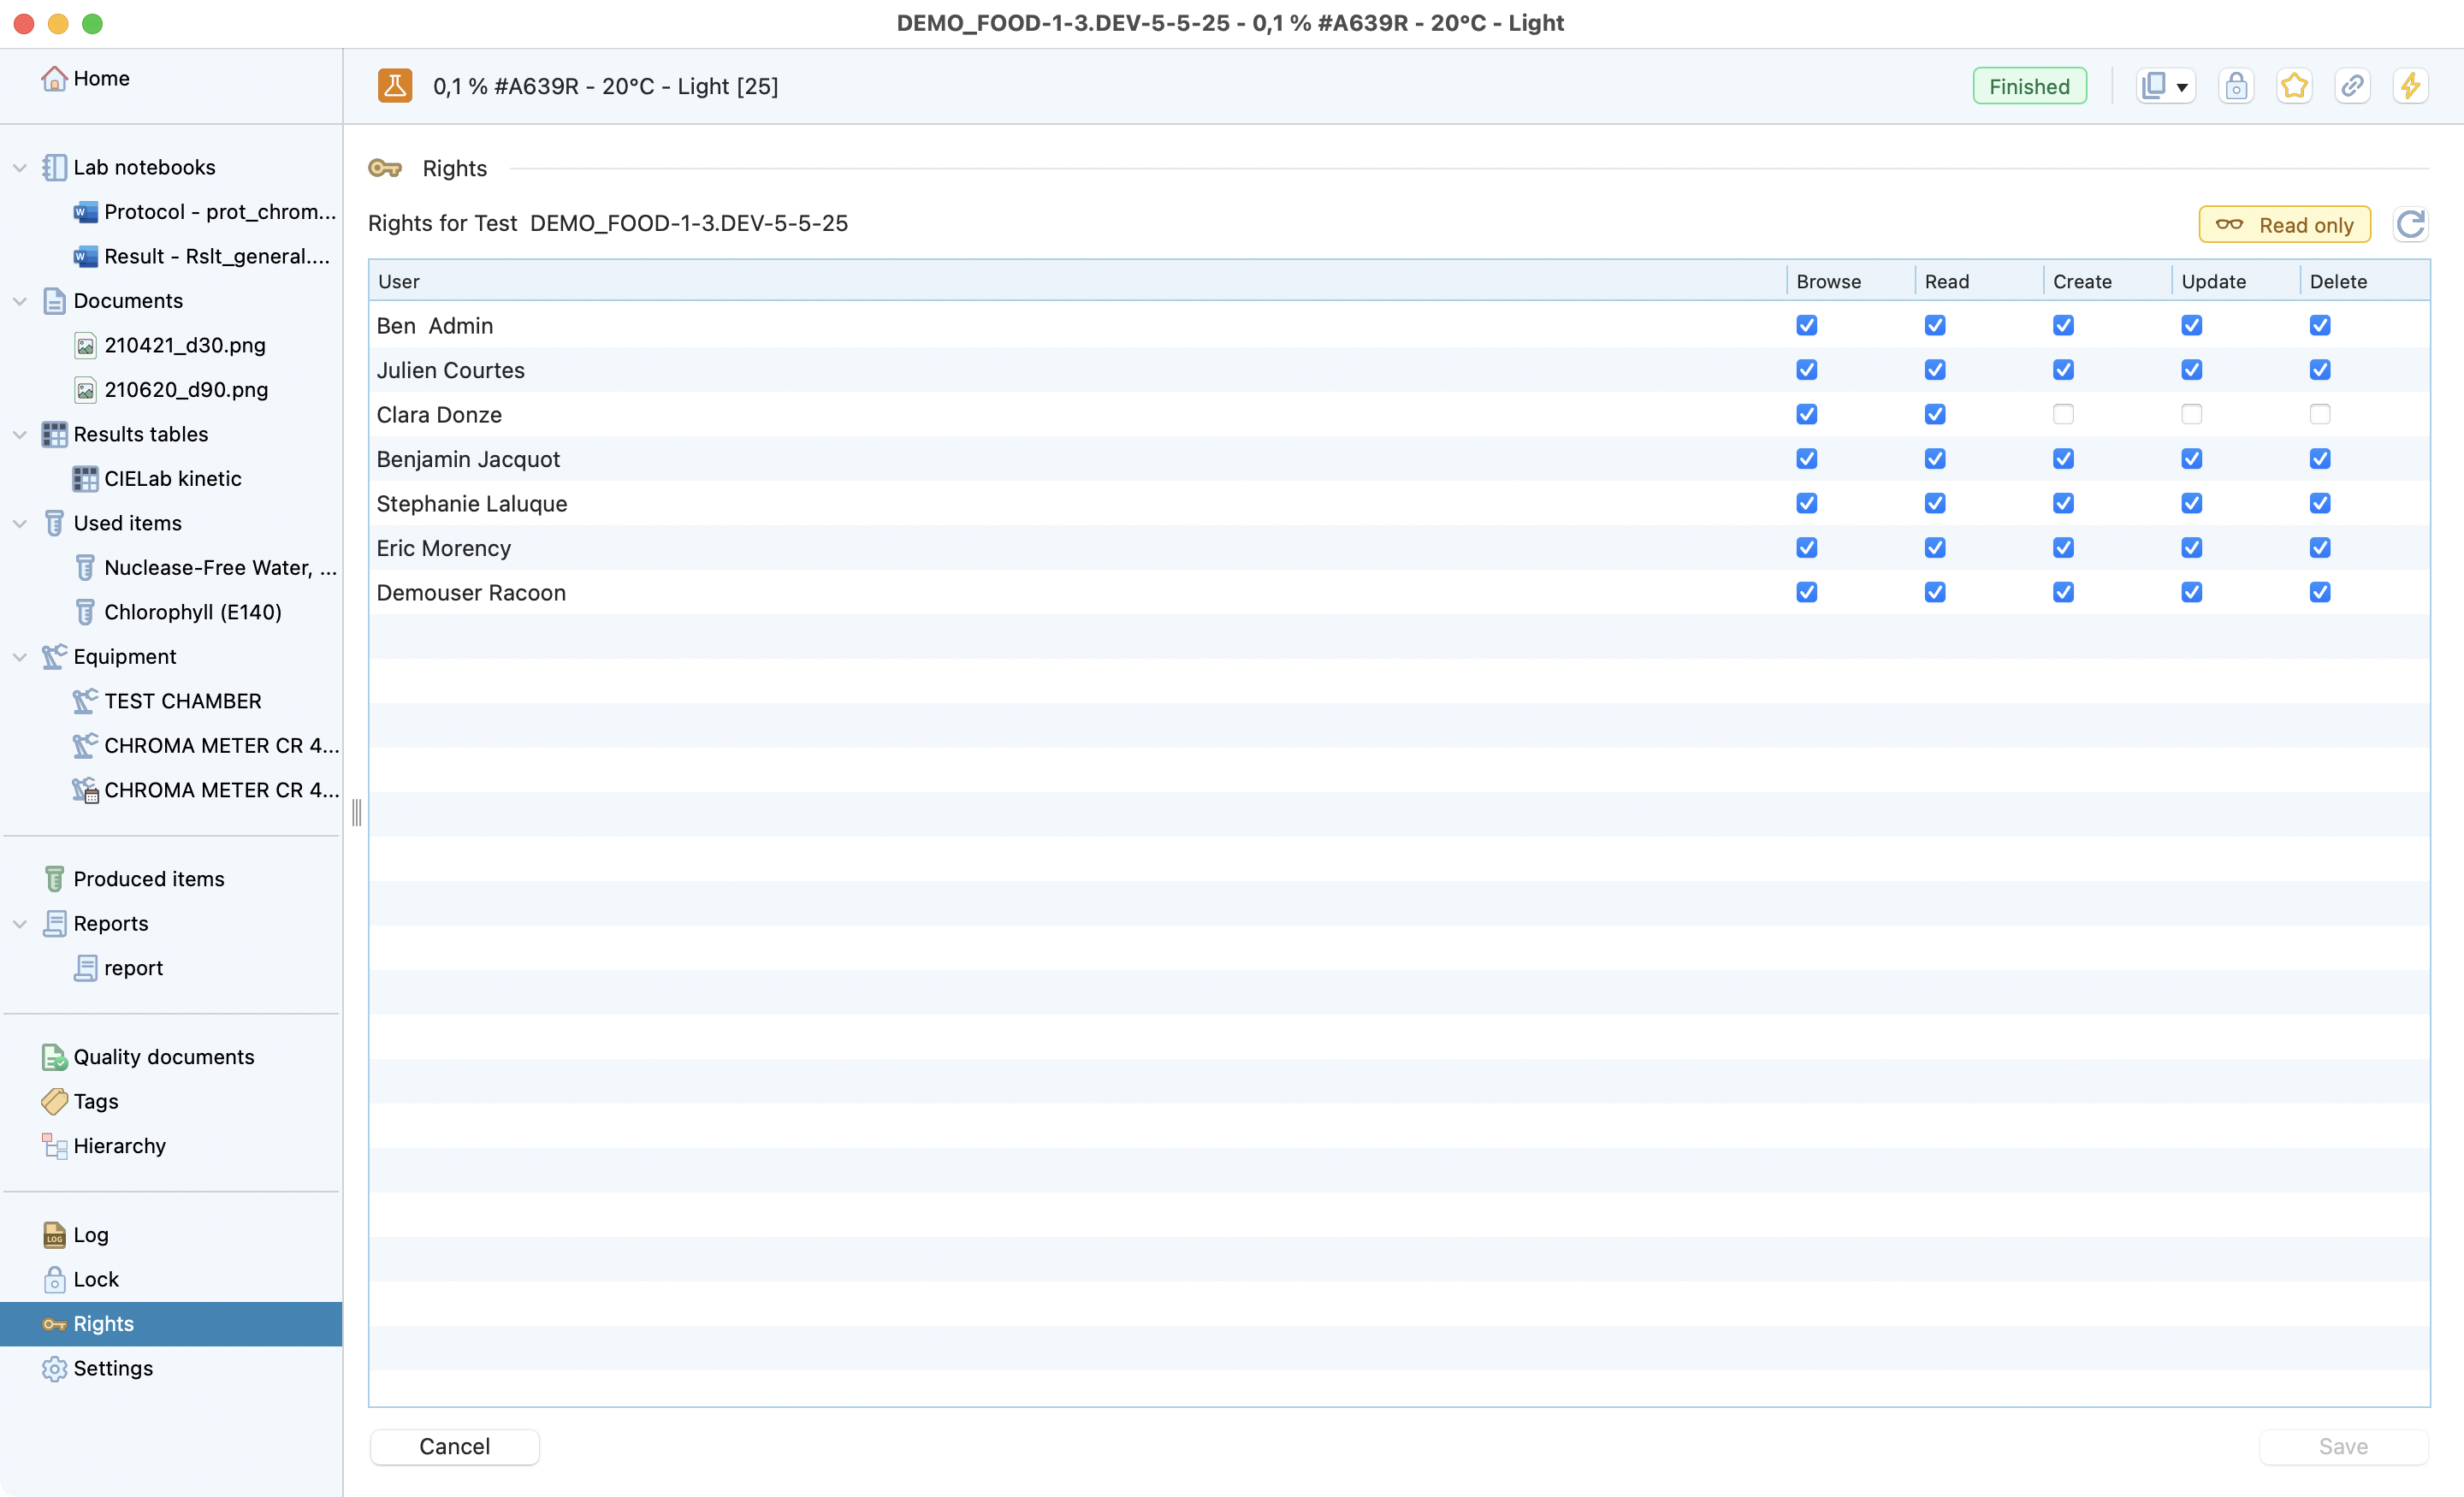
Rights view inside a test.
Logs
Here you can have full traceability and check all the modifications and the person who performed it. It is possible to search on your test modifications by using filters:
Type of action: create, open, update, delete and duplicate.
User.
Dates.
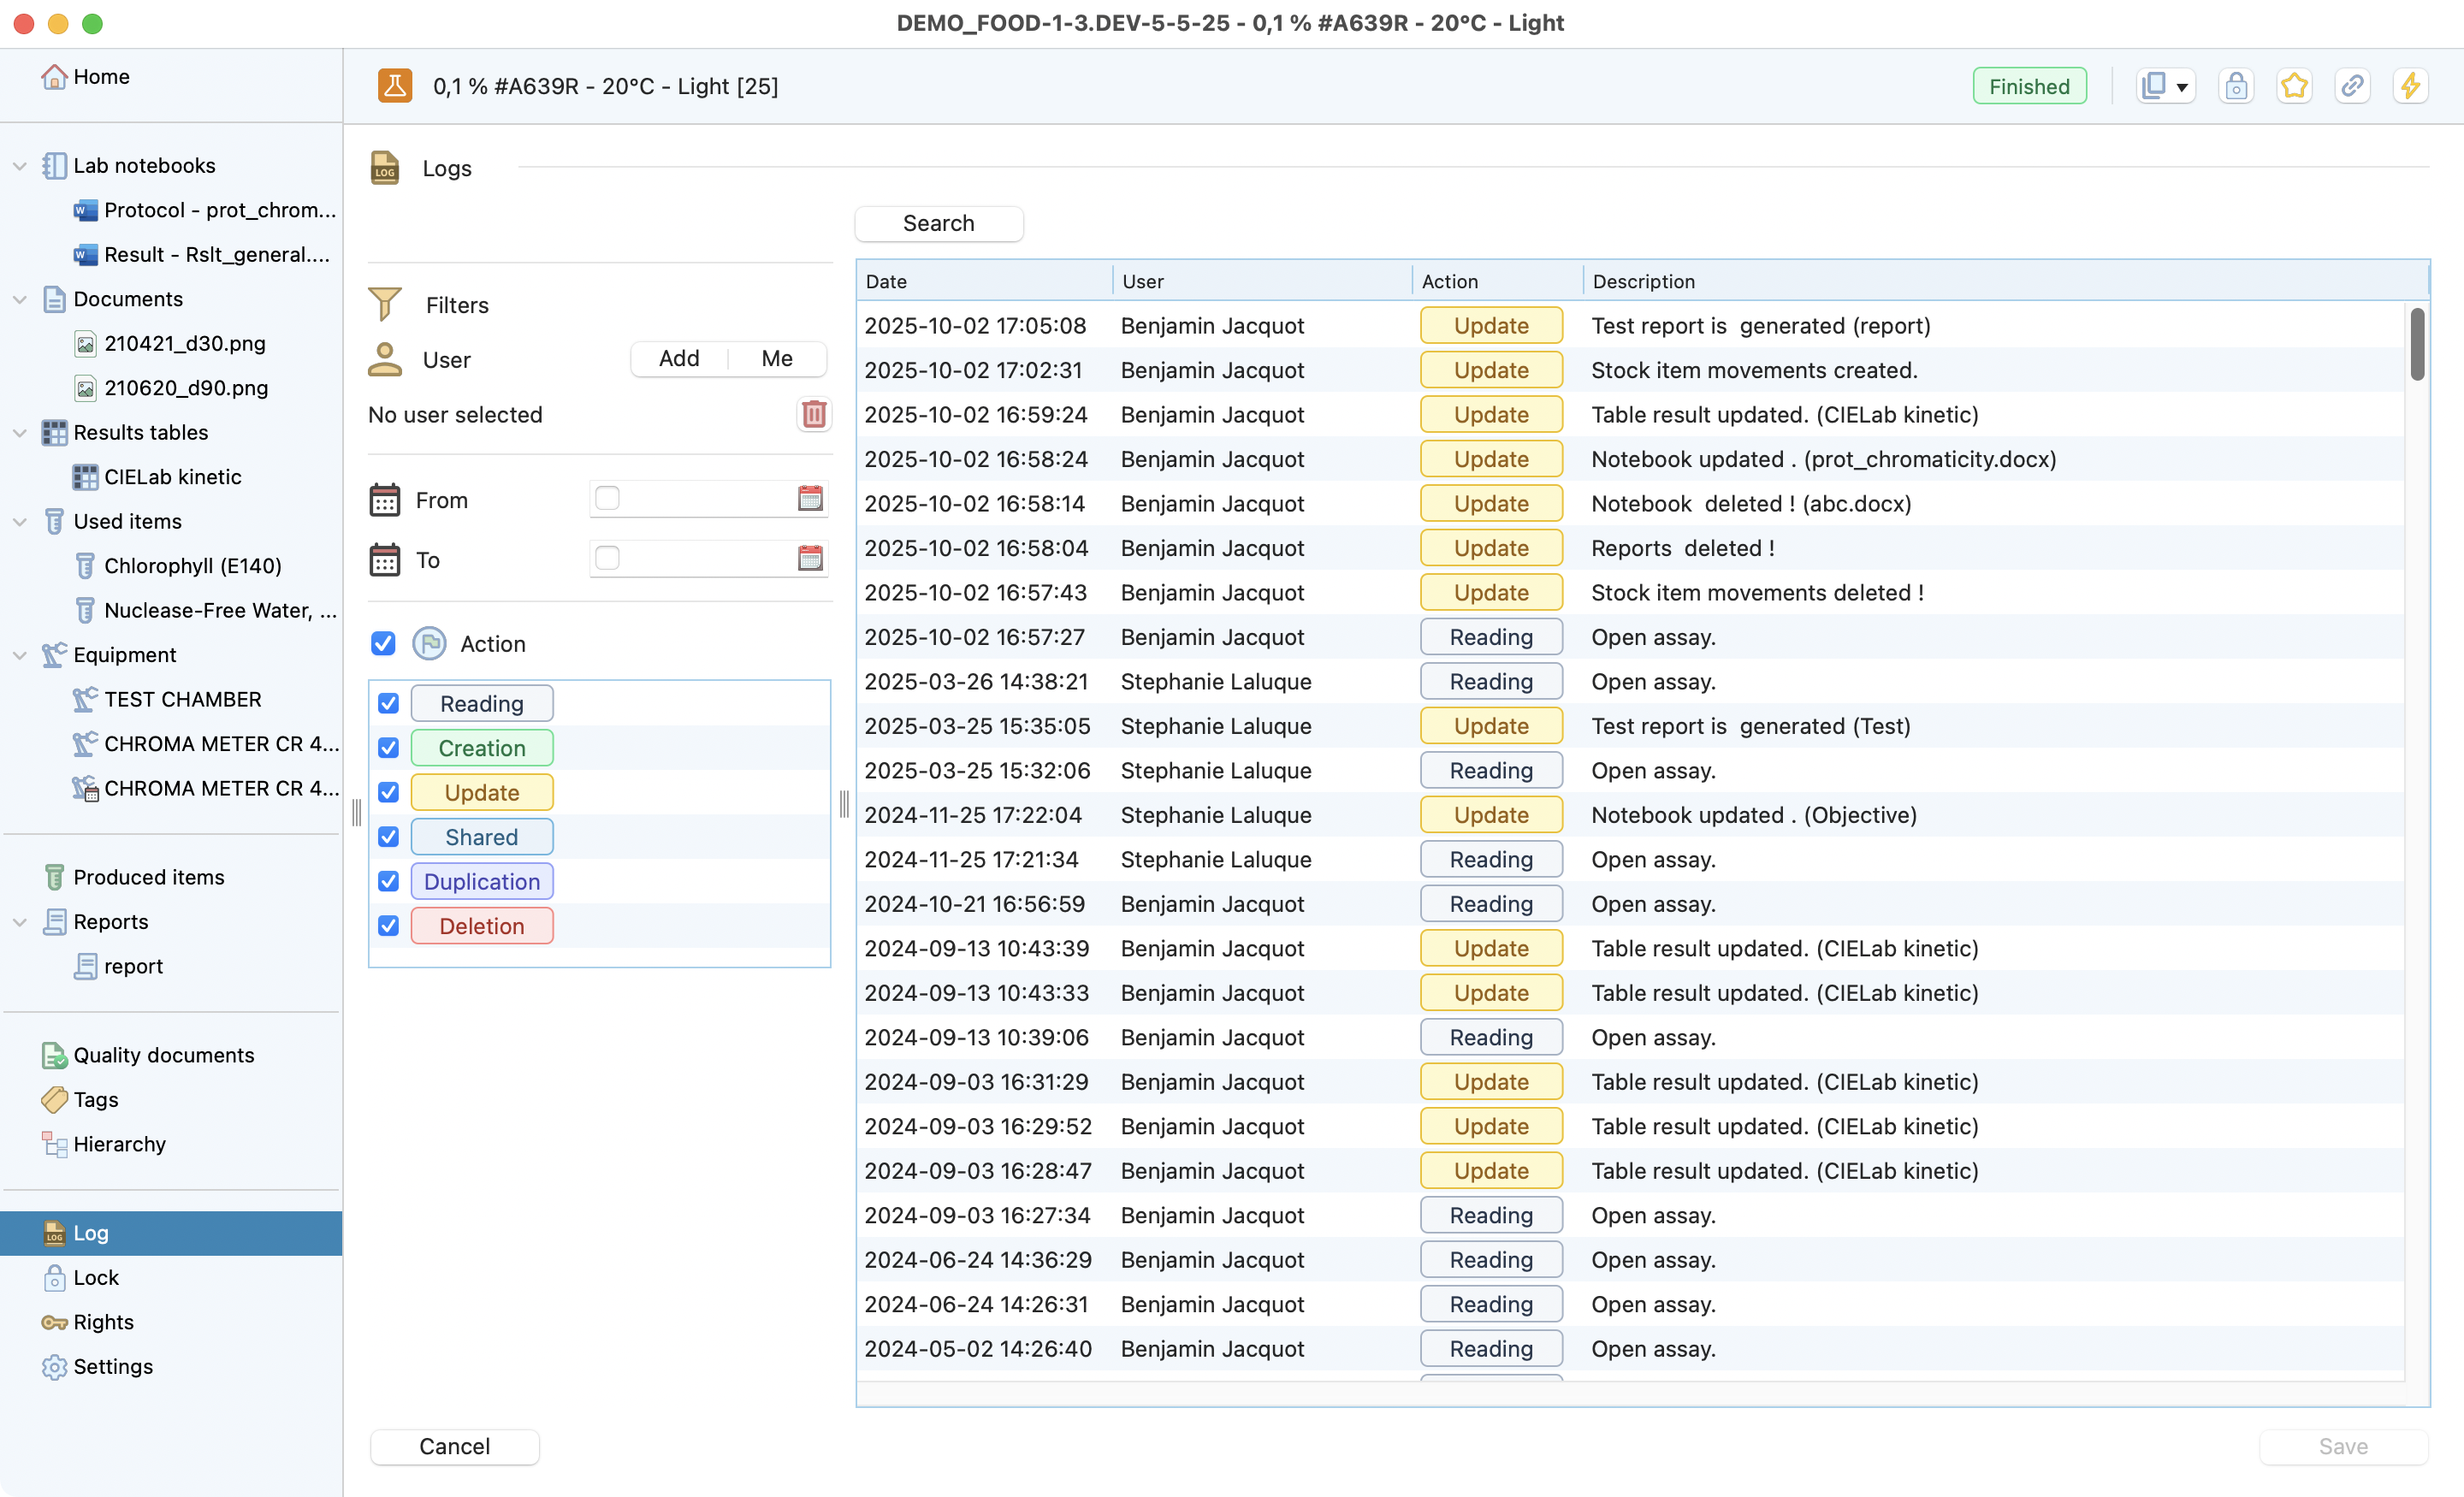
Logs view inside a test.
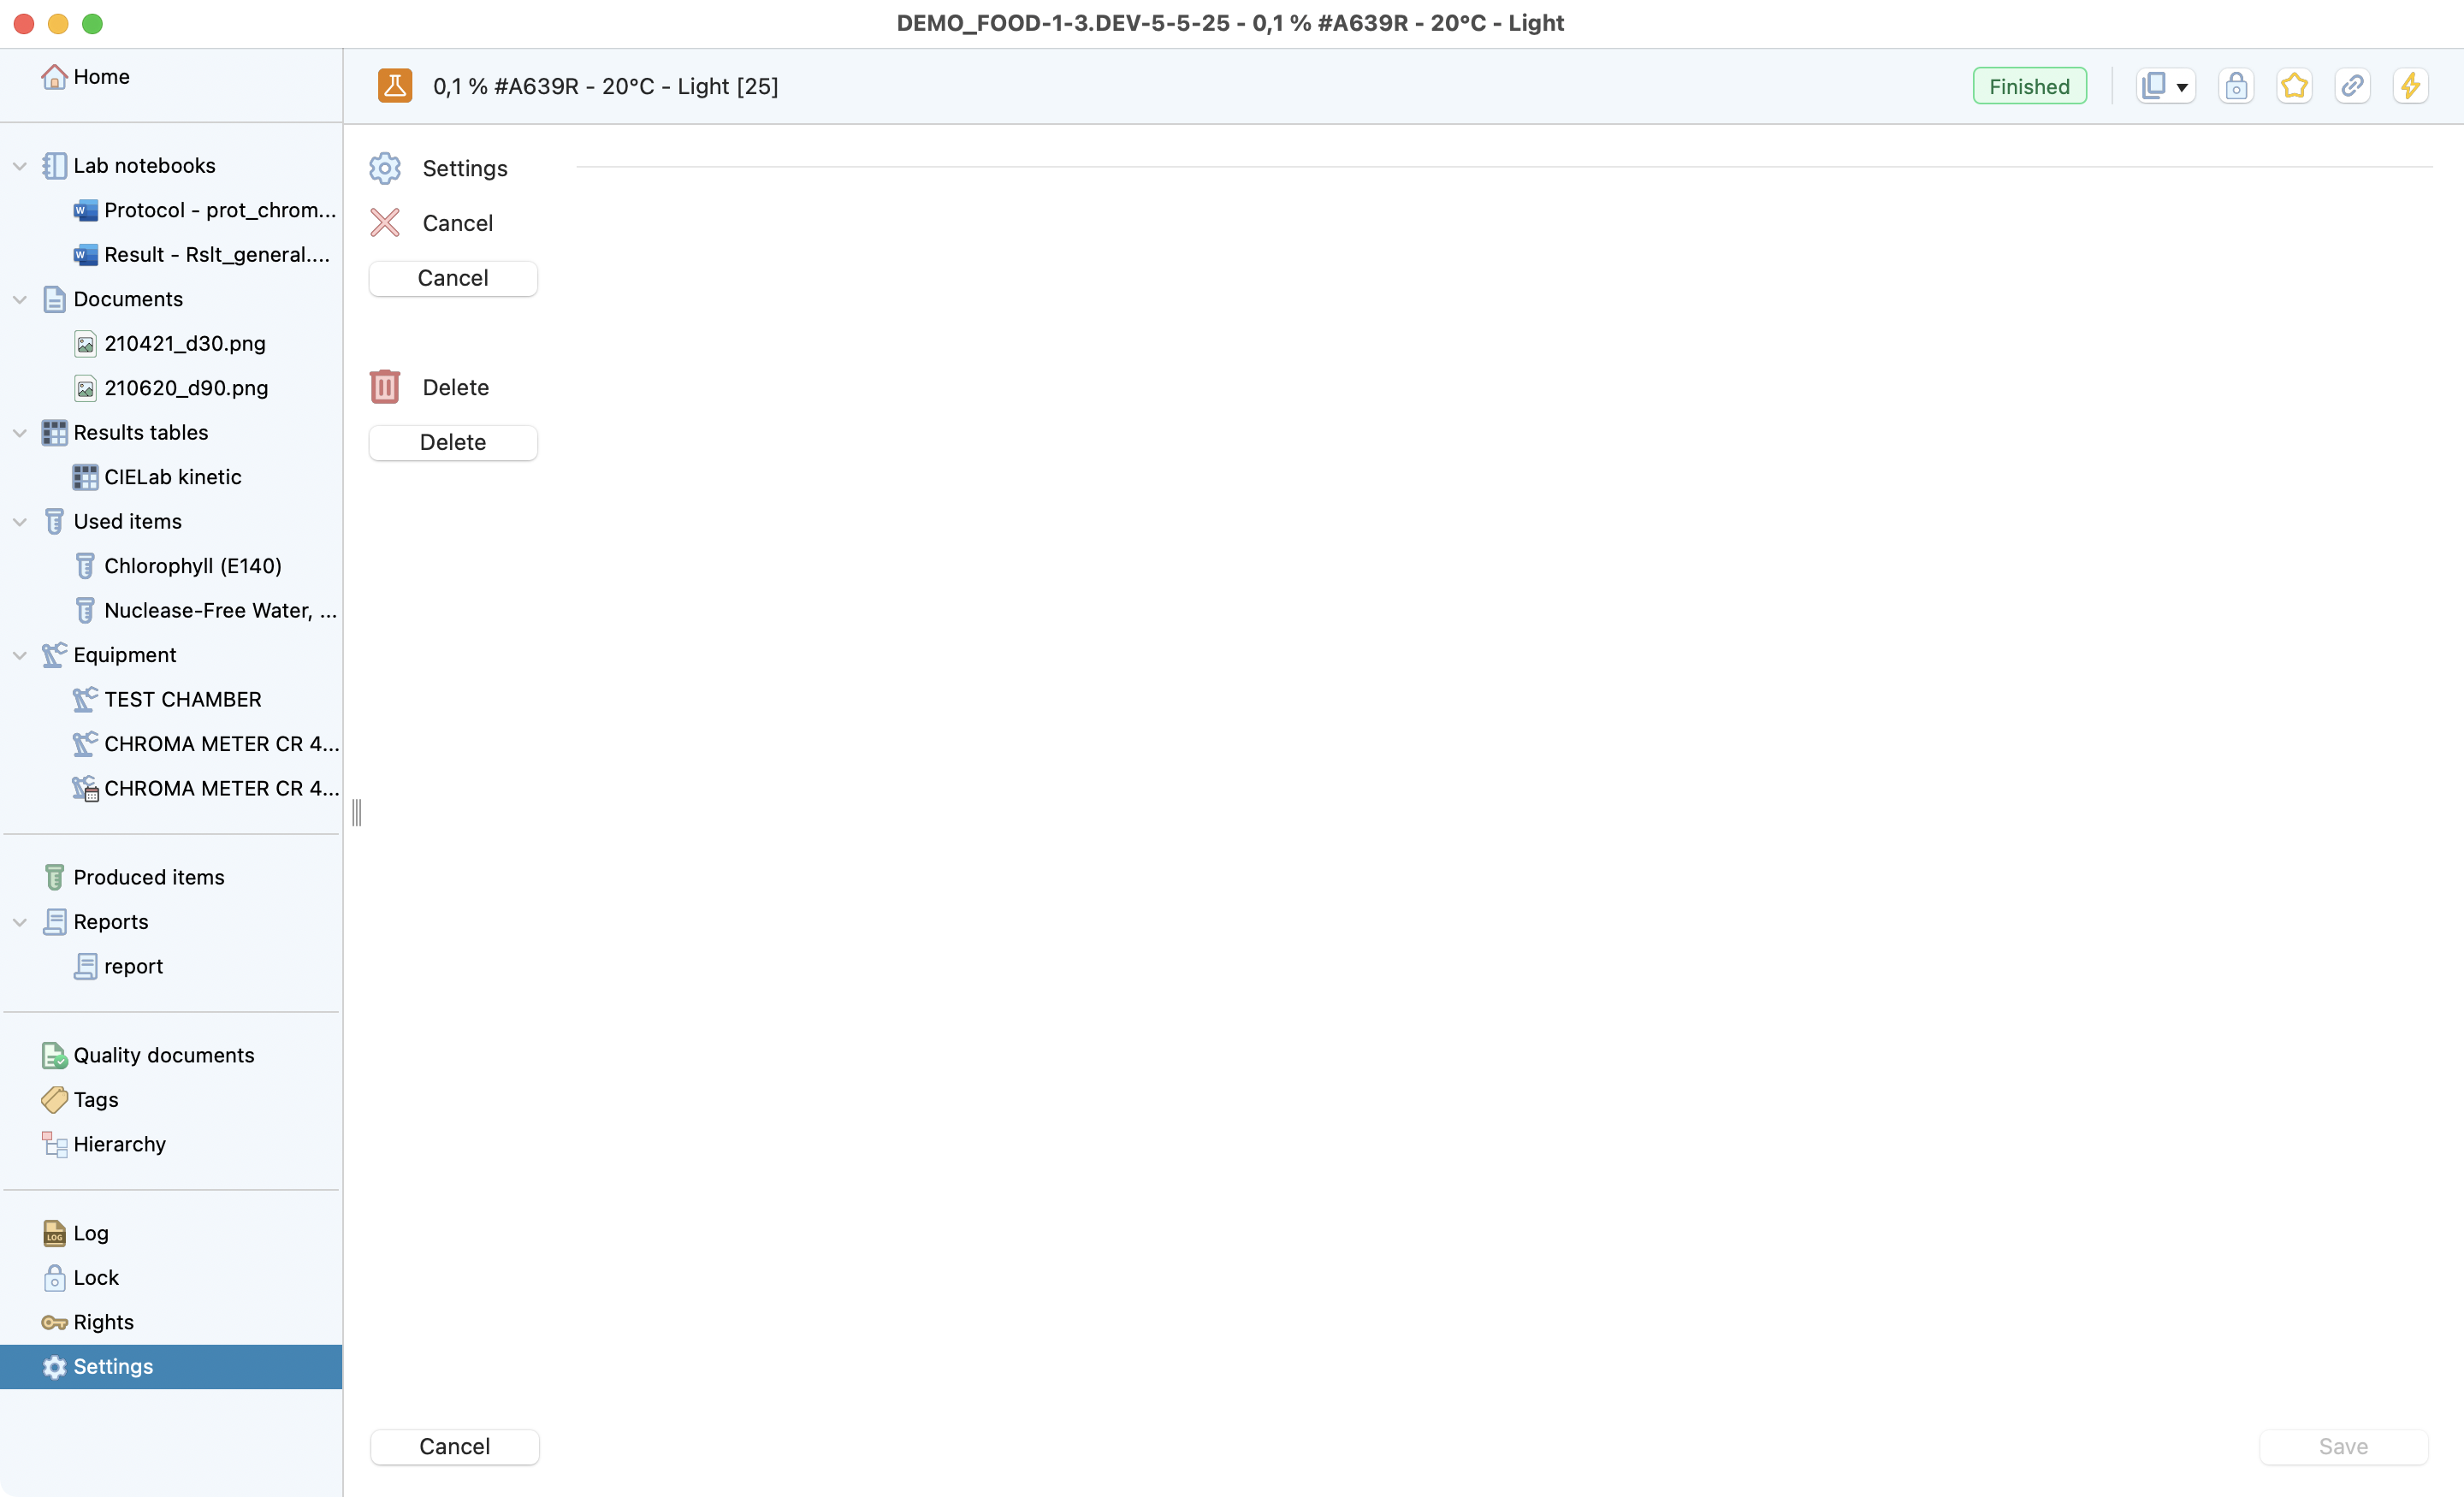
Settings
Cancel or delete your test if :
you have the right to do so (not locked or signed)
there are no items linked to it.
Logs view inside a test.